
Figure 6.
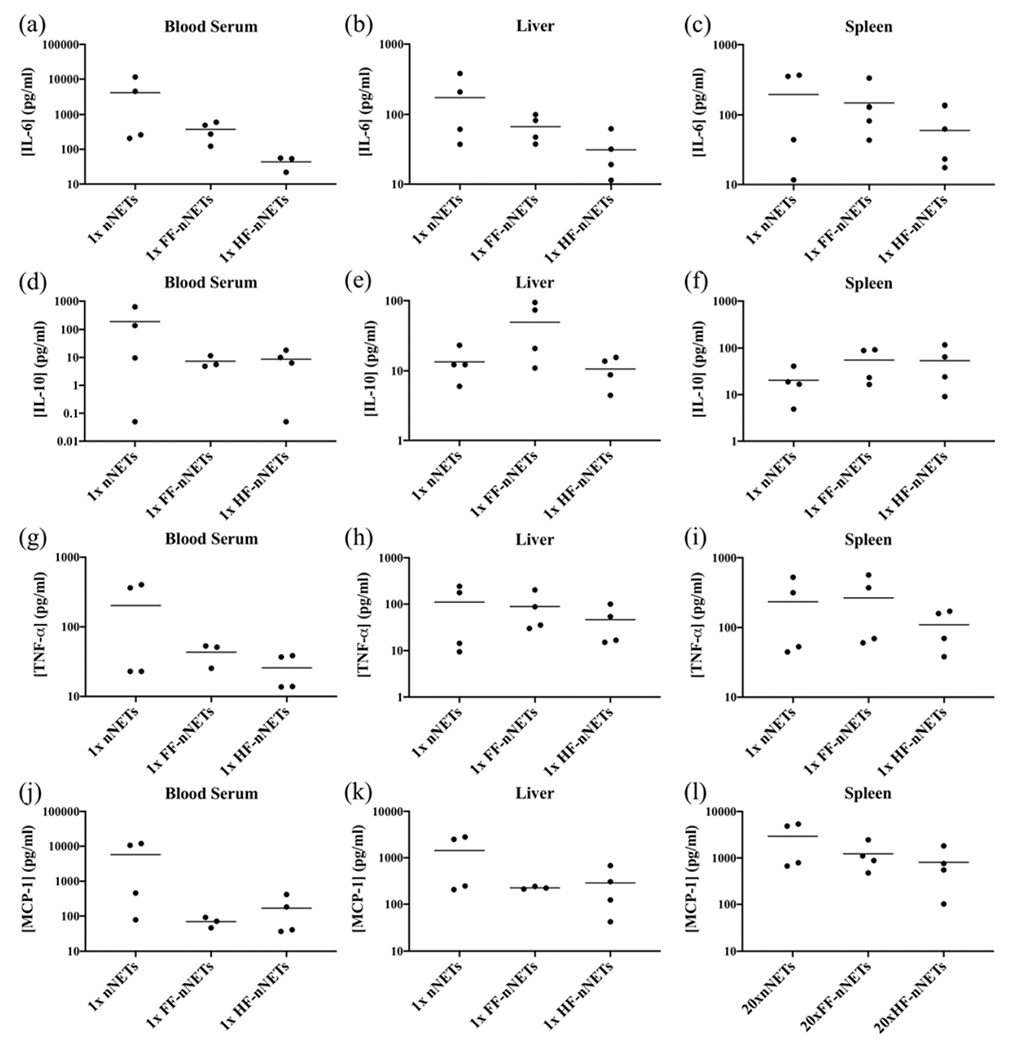
Concentration of cytokines at 4 h postinjection of 1× nNETs, 1× FF-nNETs, and 1× HF-nNETs. Concentration measurements (represented as dots) for (a–c) IL-6, (d–f) IL-10, (g–i) TNF-α, and (j–l) MCP-1 in the blood serum, liver, and spleen, respectively, are presented. Horizontal bars represent the mean values associated with a given cytokine concentration.