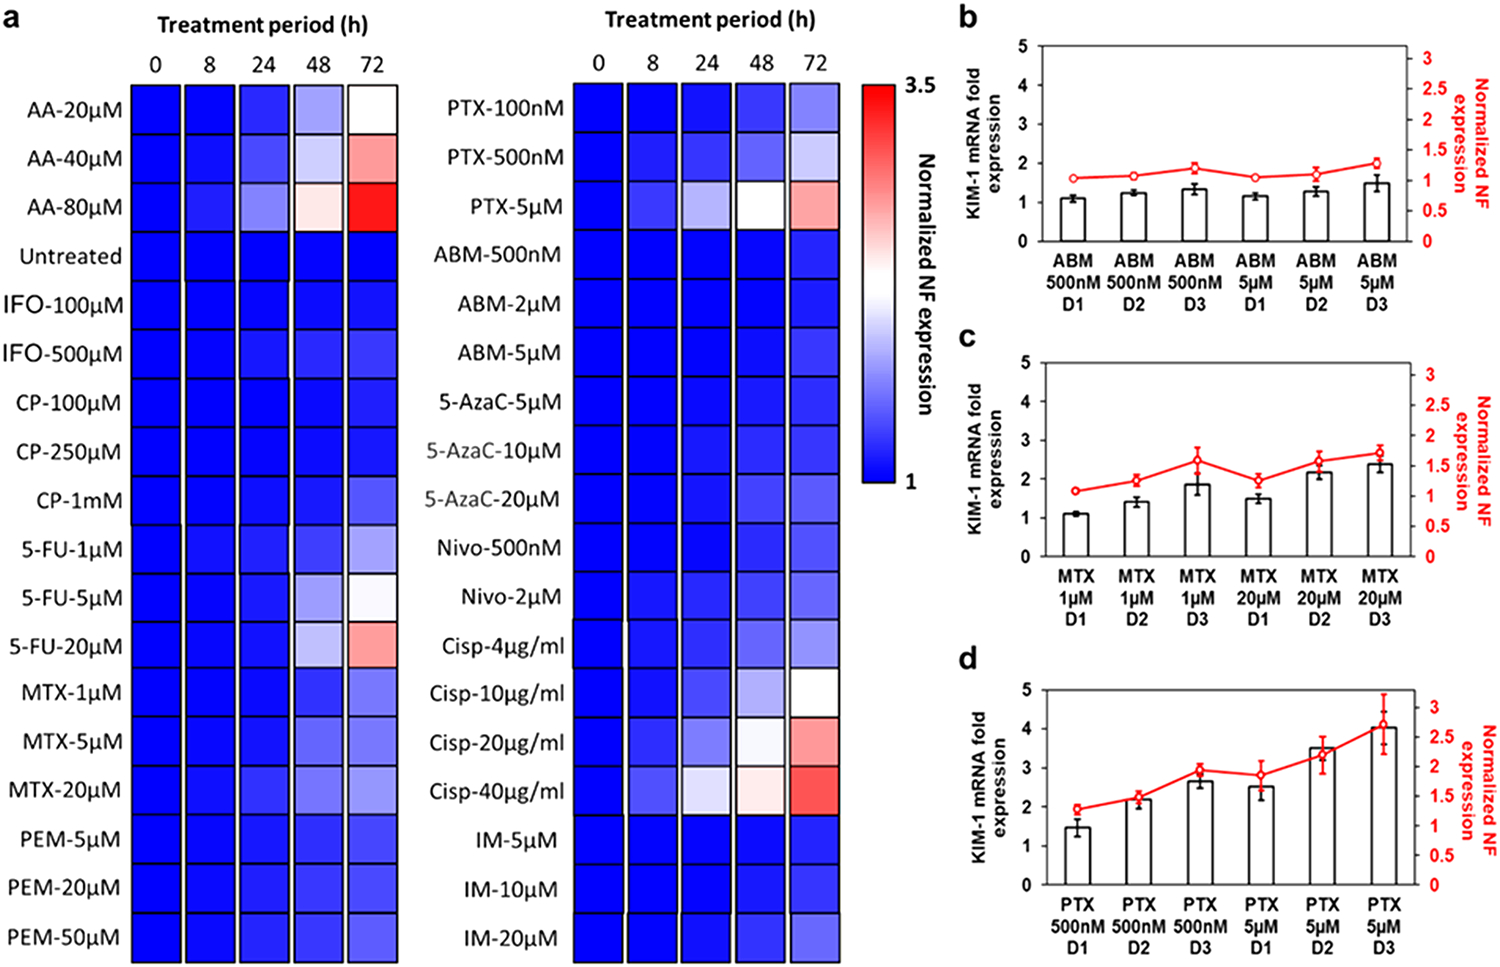
Figure 5.

KIM-1 NF signal profile on primary kidney epithelial tubuloids following treatment with 10 anticancer drugs. (a) Heatmap showing normalized KIM-1 NF expression after 8, 24, 48, or 72 h of drug treatments (N = 6). Column-line plot showing correlation between KIM-1 NF expression (red line) and KIM-1 mRNA fold expression (black bars) after the treatment with (b) ABM (500 nM and 5 μM), (c) MTX (1 and 20 μM), or (d) PTX (500 nM and 5 μM). N = 6.
