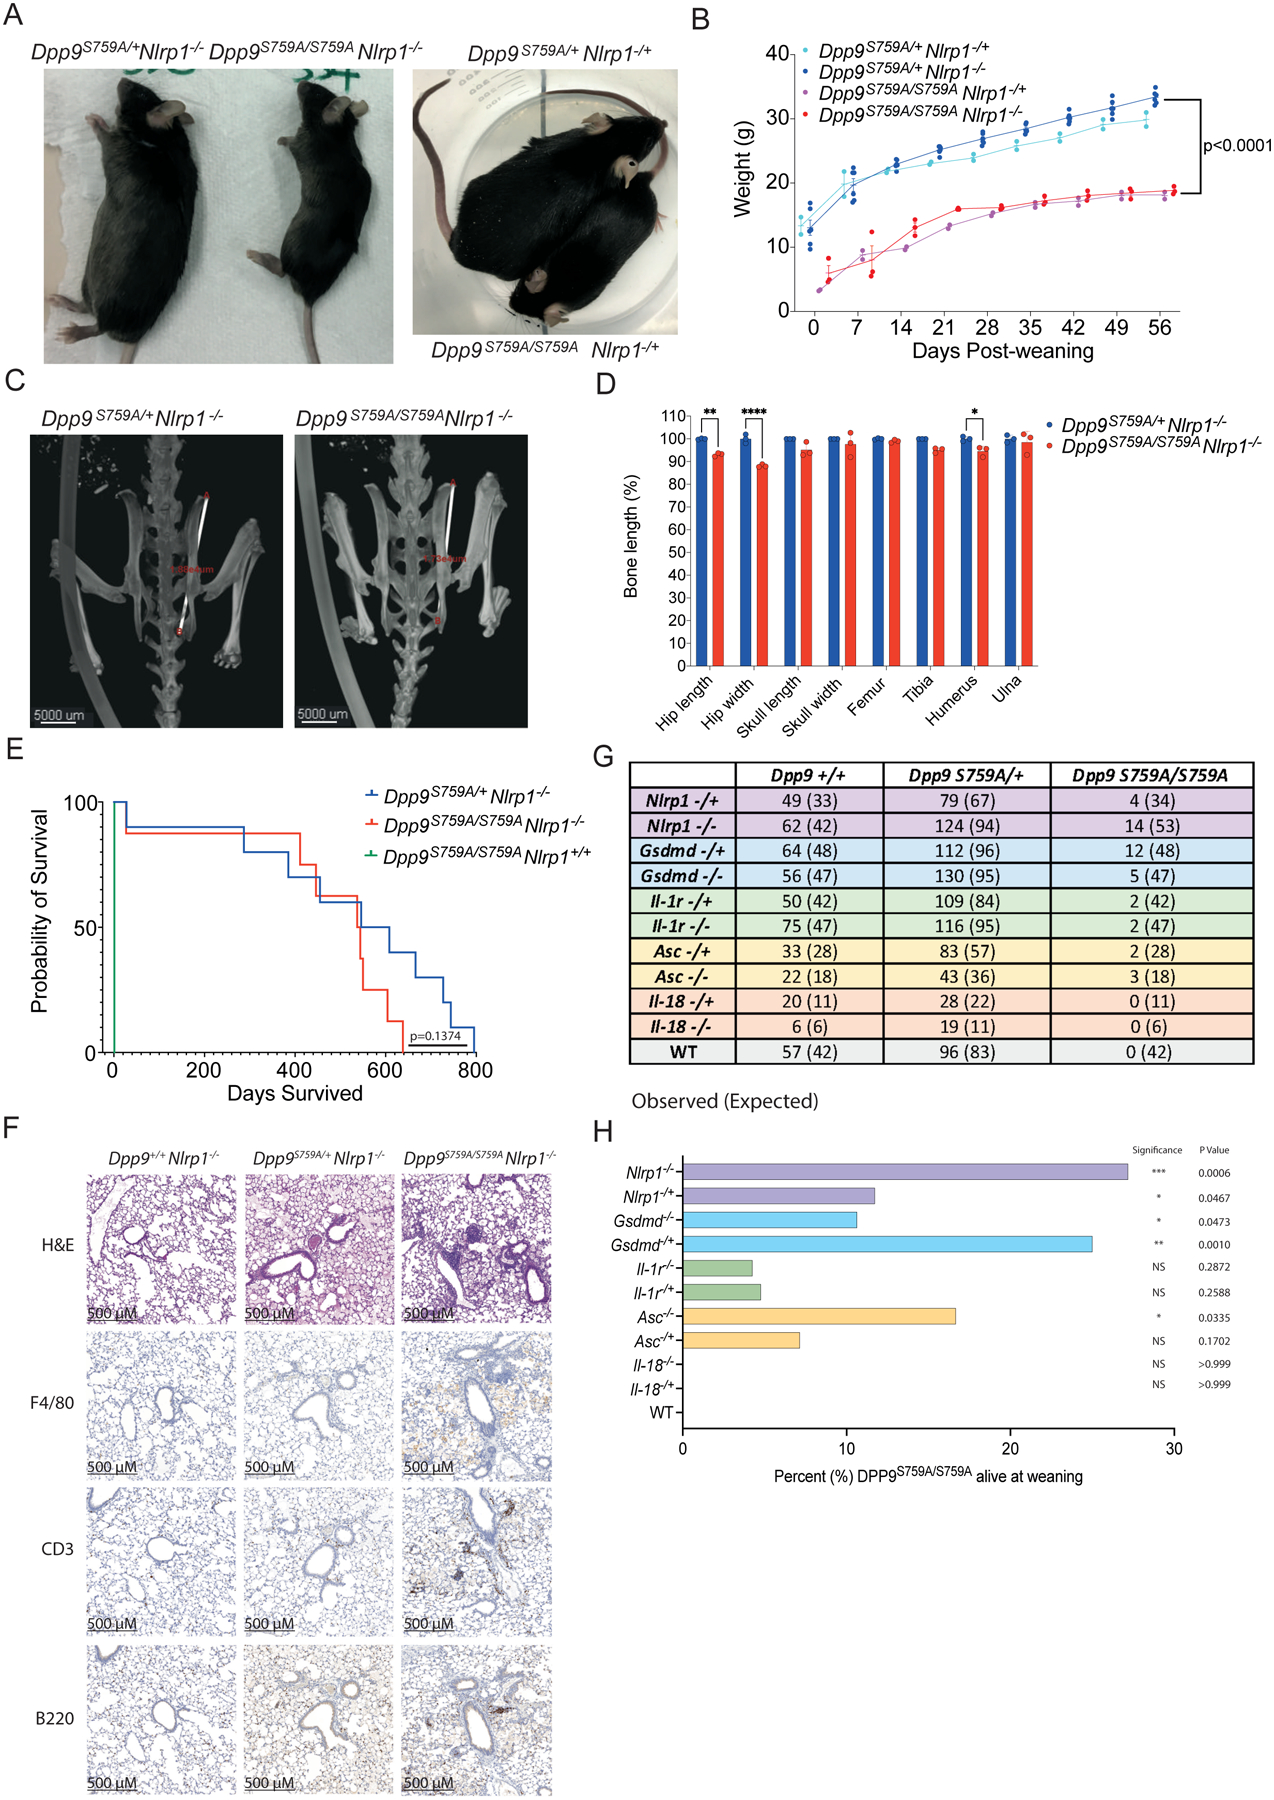
Fig. 3: Deficiency of NLRP1 and downstream signaling molecules rescues neonatal lethality of Dpp9S759A/S759A mice.

(A) Viable, 6-month-old male Dpp9S759A/S759A Nlrp1−/− and Dpp9S759A/S759A Nlrp1−/+ mice are runted compared to respective Dpp9S759A/+ Nlrp1−/− or Dpp9S759A/+ Nlrp1−/+ littermates.
(B) Male Dpp9S759A/S759A Nlrp1−/− and Dpp9S759A/+ Nlrp1−/− mice were weighed weekly for 8 weeks post weaning. n=2–6 mice per genotype, error bars represent mean ±SD. Statistical significance was calculated based on the Dpp9S759A/S759A Nlrp1−/− and Dpp9S759A/+Nlrp1−/− mice using a paired t-test.
(C) Example images of skeletal measurements and (D) quantification of 6-month-old Dpp9S759A/S759A Nlrp1−/− and Dpp9S759A/+ Nlrp1−/− mice imaged via MicroCT scanning. Measurements are normalised to the average Dpp9S759A/+ Nlrp1−/− values of mice of the same sex. n=3 mice per genotype, both male and female. Error bars represent mean ±SEM. *p<0.05, **p<0.005, ****p<0.0001 (2way ANOVA)
(E) Kaplan Meier survival curve of Dpp9S759A/S759A Nlrp1−/− and Dpp9S759A/+Nlrp1−/− mice, starting at weaning age. n=8–13 per genotype, both male and female. Statistical significance was determined by a Mantel-Cox test.
(F) Representative section of lung tissue from 6-month-old Dpp9S759A/S759A Nlrp1−/− and Dpp9S759A/+ Nlrp1−/− mice stained with Hematoxylin and eosin or immunohistochemistry of F4/80, B220 or CD3 antibodies. n=3 mice per genotype, both male and female.
(G) The number of viable mice at weaning age (~3 weeks old) of various genotypes were genotyped and tallied, this is the ‘observed’ number depicted on the left of each cell. Mendelian ratios were used to calculate ‘Expected’ number of mice per genotype, written in brackets on the right of each cell.
(H) Graphical representation of the percentage of Dpp9S759A/S759A mice surviving to weaning for each genetic cross. Statistical analysis was performed using Fisher’s exact test.
