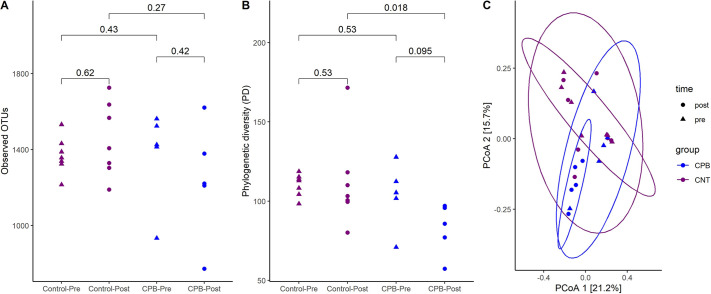
Fig. 2.
α- and β-diversity plots in CPB/DHCA group and controls. (A) Observed operational taxonomic units (OTUs) in the CPB/DHCA group compared to the control group. There were no statistically significant differences in the total number of bacteria present between the two groups. (B) Phylogenetic diversity between the CPB/DHCA group and the control group. There was a significant decrease in phylogenetic diversity in the CPB post-operative samples compared to the control post-operative samples. (C) β-diversity via UniFrac distance matrix. There was a statistically significant difference in the β-diversity in the CPB group compared to the control group. The numbers indicate P-values using unpaired Wilcoxon rank sum test. PCoA, principal coordinates analysis.

