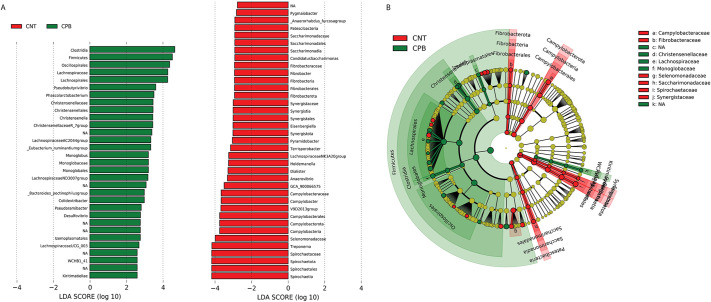
Fig. 3.
LEfSE plot and cladogram of bacterial associations in CPB/DHCA group and controls. (A) LEfSE plot providing organisms associated with either the CPB/DHCA group (green) or the control group (CNT, red). The logarithmic score details the strength of the association of each organism to a specific group. (B) Cladogram of the LEfSE analysis with organisms in the shaded green area associating more strongly with the CPB/DHCA group and organisms in the shaded red area associating with the control group. The microbial compositions were compared at different taxonomic levels. LDA, linear discriminate analysis.

