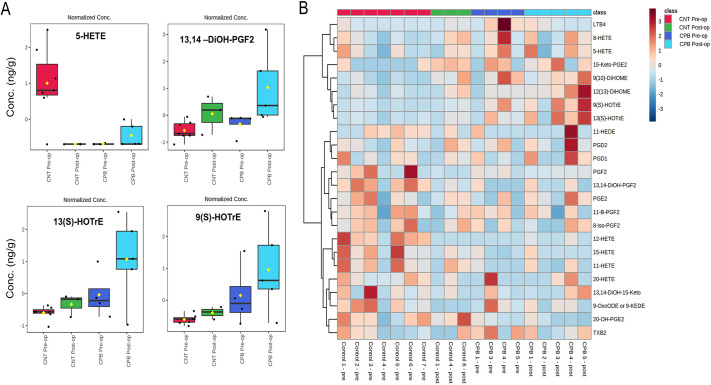
Fig. 5.
Changes to stool eicosanoids between CPB/DHCA group and controls. (A) A selection of eicosanoids with variation between the CPB/DHCA group and the control (CNT) group. Boxes indicate the 25-75th percentiles, whiskers show 1.5 times the interquartile range, the central line marks the median, and the mean is indicated by the yellow diamond. (B) A heatmap plot of the association of various eicosanoids with both pre-operative and post-operative samples of the CPB/DHCA group and controls. The Mann–Whitney U test was used to assess differences between the two groups. Conc, concentration; HETE, Hydroxyeicosatetraenoic acid; DiOH-PGF2, dihydro-prostaglandin 2; HOTrE, hydroxyoctadecatrienoic acid.

