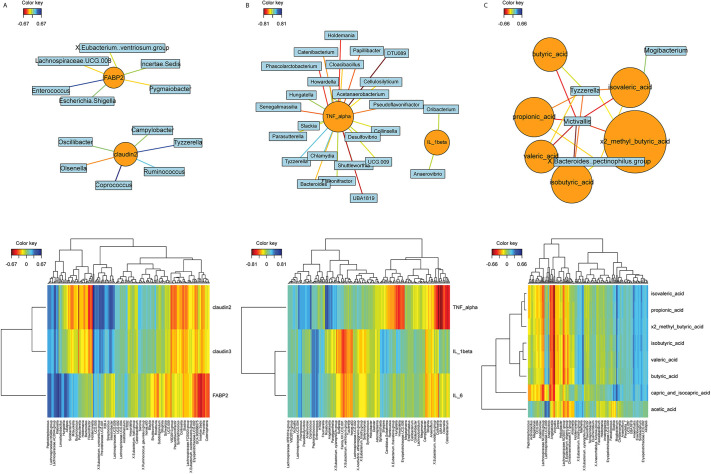
Fig. 6.
Canonical correlation analysis of the microbiome with EBD, cytokines and SCFA. (A) Network map (top) and heatmap (bottom) of the markers of EBD and associated organisms. (B) Network map (top) and heatmap (bottom) of inflammatory cytokines and associated organisms. (C) Network map (top) and heatmap (bottom) of SCFAs and associated organisms.

