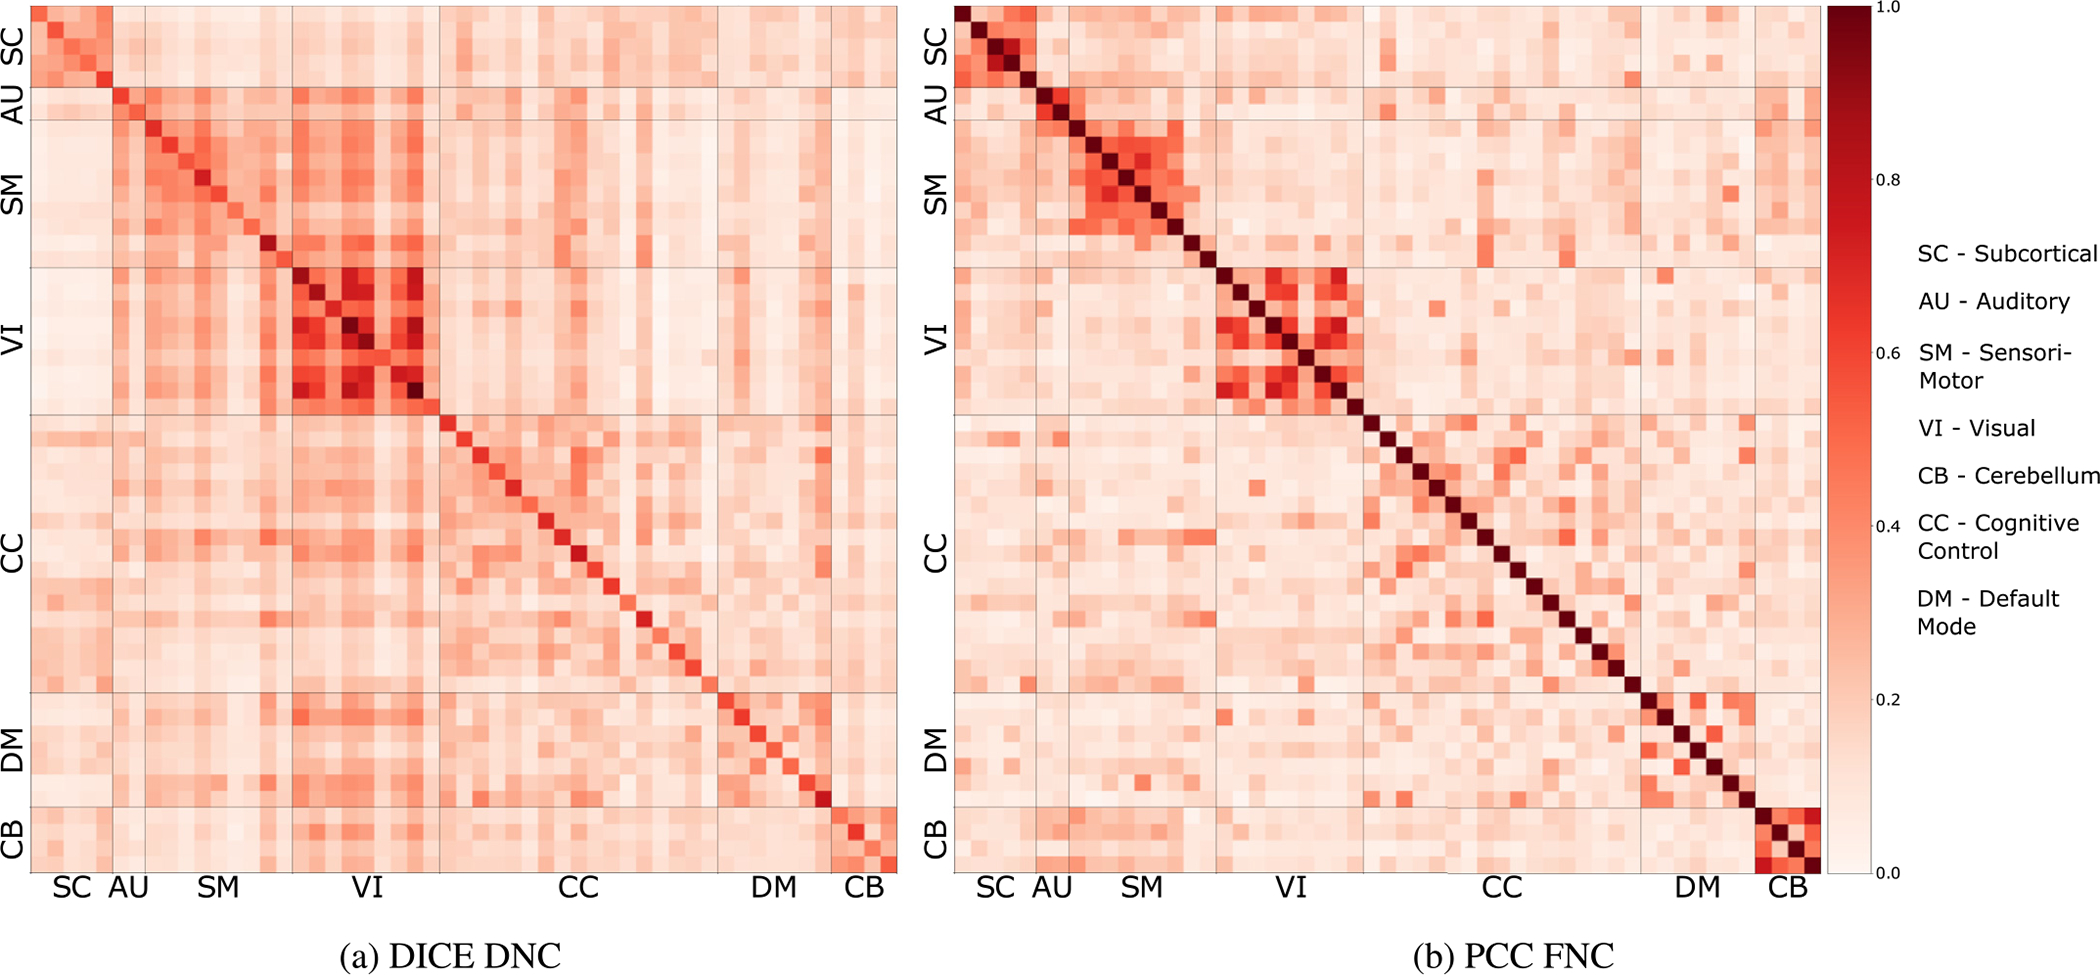
Fig. 4.

We compare our estimated DNC with computed FNC using PCC method. 4 a is the connectivity matrix generated by our model for FBIRN dataset. We used a test fold of 16 subjects and computed mean FNC for all subjects (10 trials per subject). 4 b is the mean connectivity matrix of the same subjects generated by PCC. Both figures show similar intra-network connectivity patterns, which verifies the correctness of the connectivity matrix learned by our model. Our estimated DC is directed and captures more inter-network connectivity than FNC. To match the positive weights of our model, we have normalized the FNC from 0 to 1 instead of −1 to 1.
