
Fig. 7.
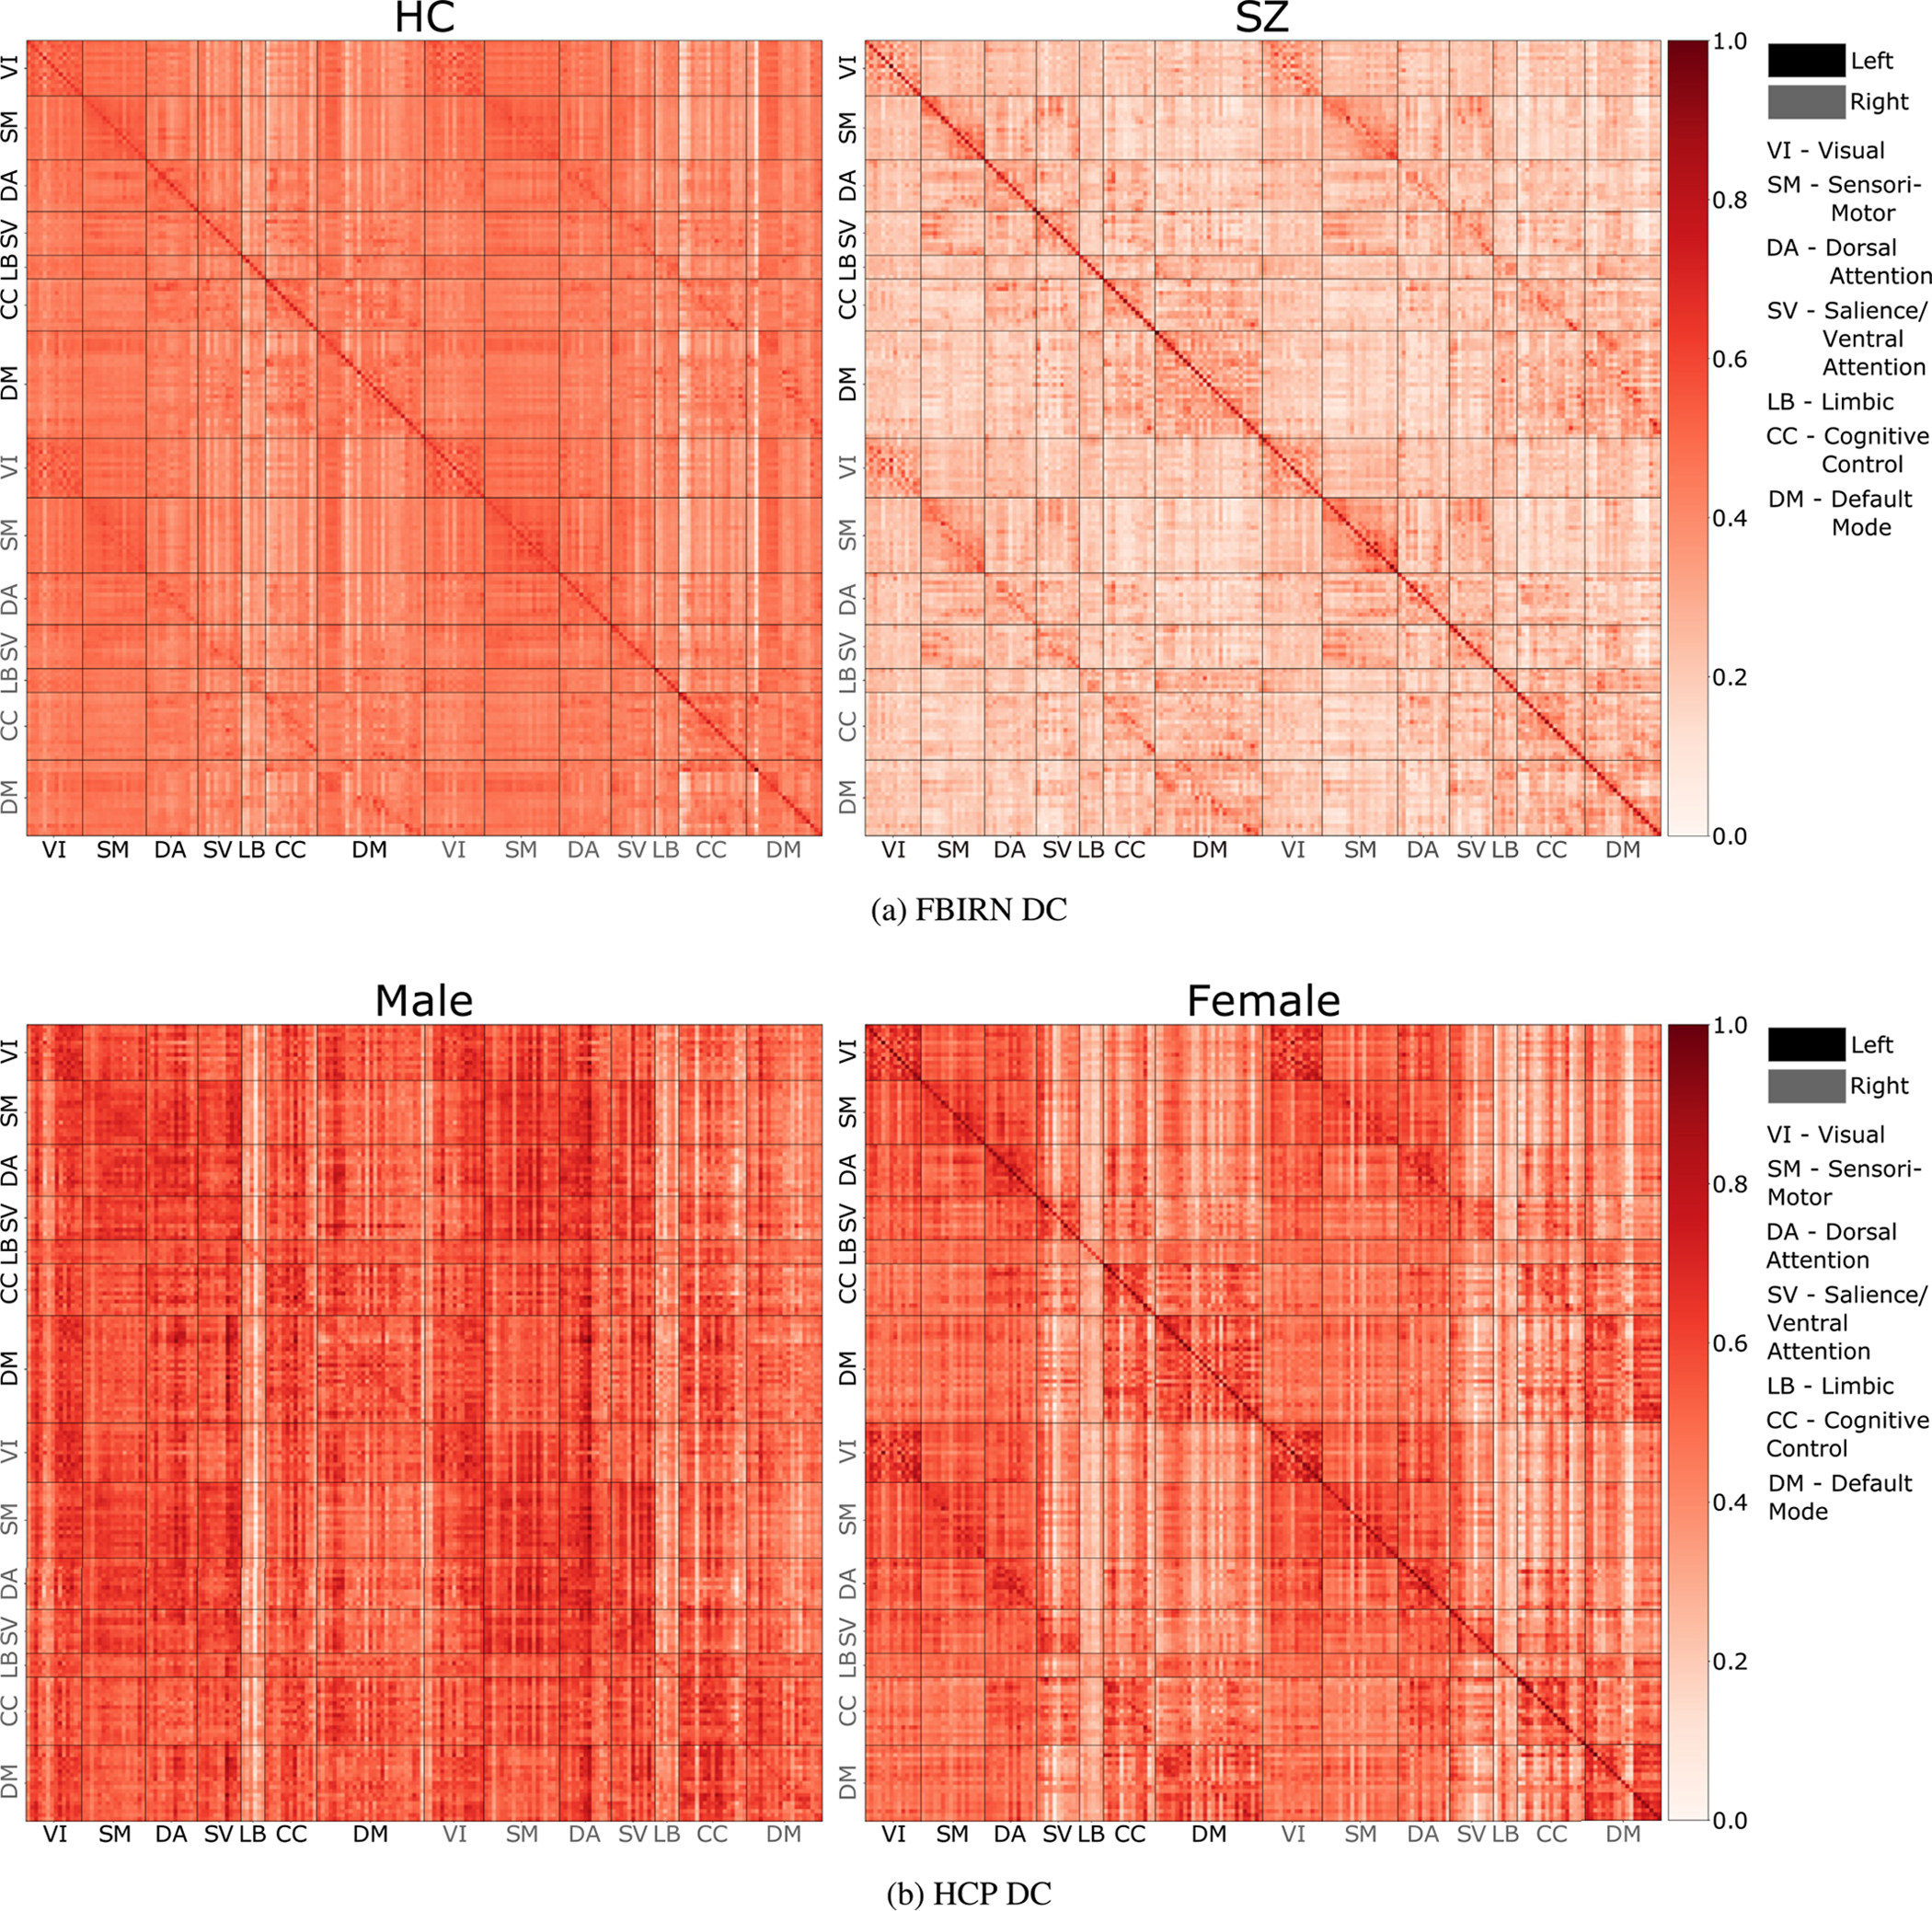
We compare the estimated DCs of HC with SZ and male with female using region-based (ROIs) FBIRN and HCP data. 7 a show high weakly connected brain networks for SZ subjects whereas 7 b show hyper-connectivity of DMN and hypo-connectivity for SMN for females as compared to females. The black and grey color denotes the regions in left and right side of the brain. Refer to Table 7 for a statistical comparison between female and male DCs.