
Fig. 9.
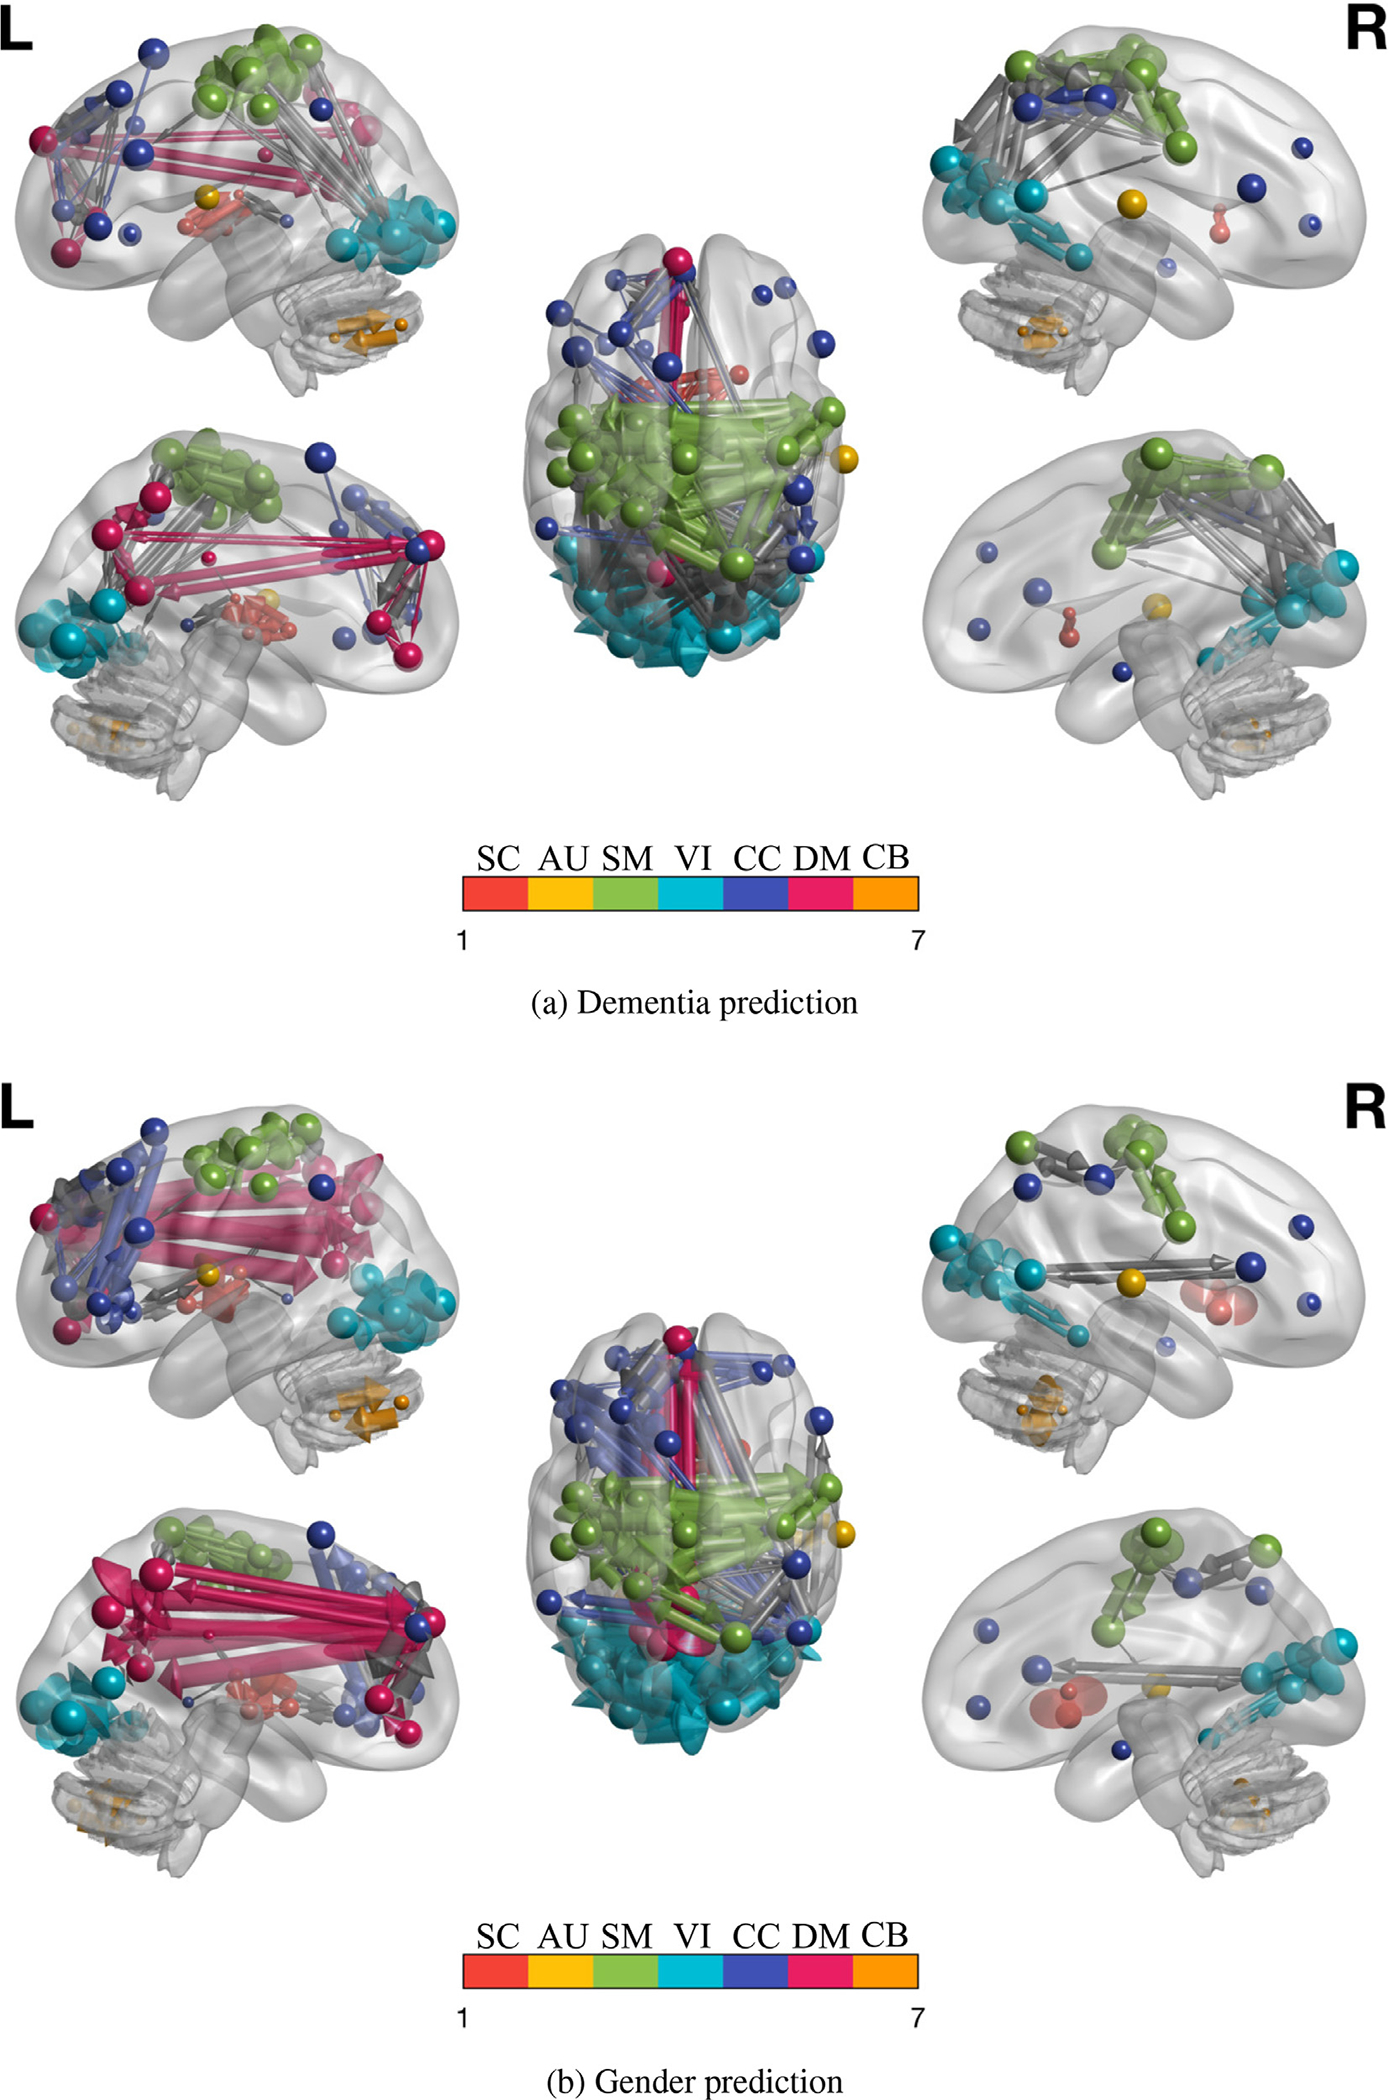
We map on the brain, the nodes and top 10% edges of the DCs, estimated for dementia and gender classification tasks, performed on OASIS dataset (same subjects). The size of the nodes is the sum of the outgoing and incoming edge weights. The arrows shows the direction of connectivity. We see a high number and size of nodes and edges for SMN and VIN for dementia 9 a, whereas for gender 9 b we see high node and edge size for DMN. Compare the red (DM) nodes and edges in Fig. 9a with b in the left side figures. Figure 9a also shows high connectivity between SM and VI networks which is missing in Fig. 9b (right side figures). This reveals the networks and edges (graphs and subgraphs) relevant to the classification signal (e.g disorder) without need of comparison with other data. The results and their impact are further discussed in Section 4.3. (For interpretation of the references to colour in this figure legend, the reader is referred to the web version of this article.)