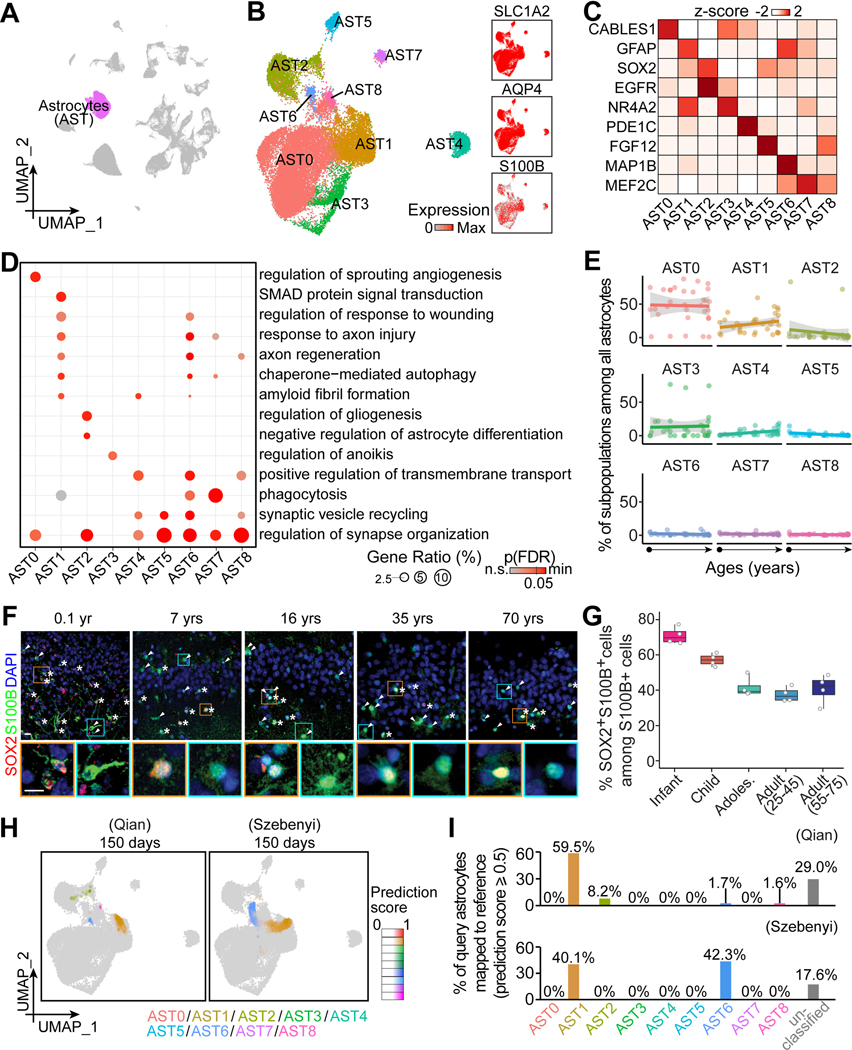
Figure 2. Transcriptomic diversity of human hippocampal astrocytes across the postnatal lifespan.
(A and B) UMAP of integrated data highlighting astrocytes (A), which were sub-clustered and visualized in UMAP colored by subpopulation and generic marker expression (B).
(C and D) Characteristics of astrocyte subpopulations. Heatmap (C) and bubble plot (D) showing representative enriched gene expression and Gene Ontology (GO) terms, respectively. p(FDR): p-value controlled for false-discovery rate.
(E) Dot plots showing the proportion of each subpopulation among all astrocytes across ages. Dots for individual specimens are fitted with linear regression fitting (lines) with 95% confidence interval (grey shades).
(F and G) Sample confocal images (F) and quantification (G) of SOX2+ cells among all S100B+ cells in the human hippocampus across ages. Asterisks and arrowheads indicate SOX2+S100B+ and SOX2-S100B+ cells, respectively. Insets boxed in orange and cyan colors show enlarged view of representative S100B+ cells that were SOX2+ and SOX2-, respectively. Scale bars, 10 μm (F). Dots represent value of quantification for individual subjects and box values represent median ± quantiles with whiskers for max and min (n = 4 subjects per stage) (G).
(H and I) UMAP projection of “astroglia” in two query datasets of hPSC-derived long-term brain organoid cultures (Qian et al., 2020; Szebenyi et al., 2021) to our in vivo astrocyte reference map (H). Colors represent the assigned subpopulations and intensity represents the prediction score for each query cell. Bar plots in (I) show the proportions of query cells mapped to our in vivo glia reference. Cells with prediction scores lower than 0.5 to any in vivo subpopulation were categorized as “unclassified”.

