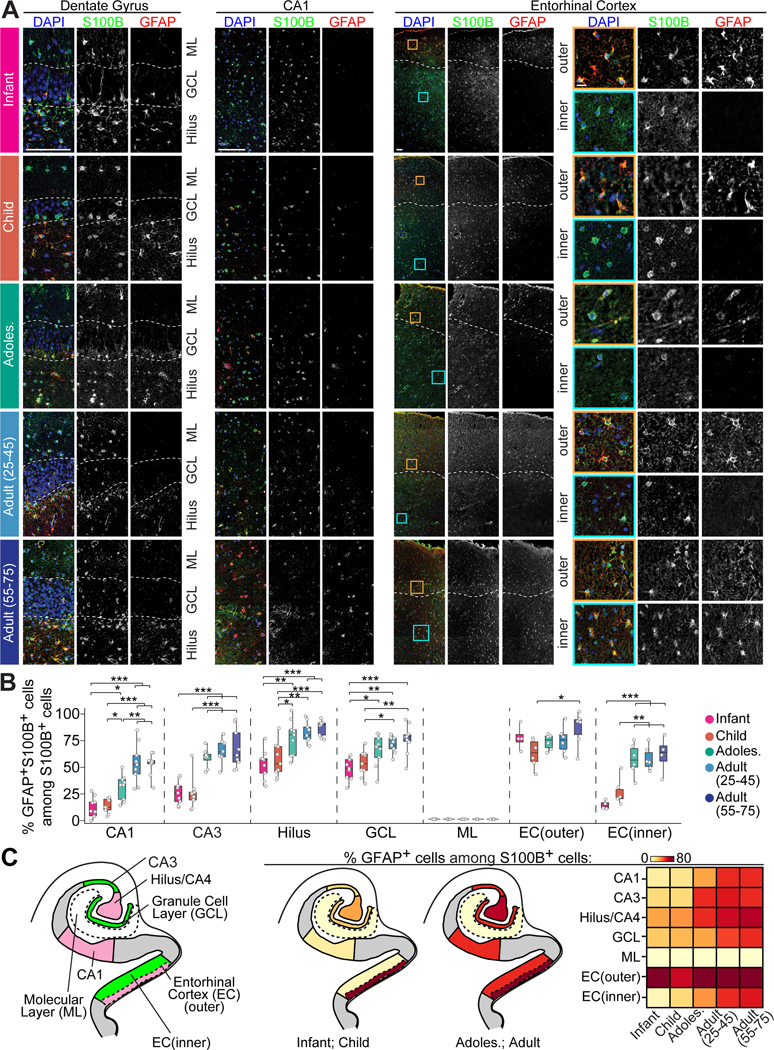
Figure 3. Spatiotemporal patterns of GFAP+ astrocytes in the human hippocampal formation across the postnatal lifespan.

(A and B) Sample confocal images (A) and quantification (B) of GFAP expression patterns among S100B+ cells in hippocampal subregions across ages. Dashed lines in representative images of the dentate gyrus indicate the upper and lower borders of the granule cell layer (A). For representative images of the entorhinal cortex, dashed lines separate the outer and inner layers, and insets boxed in orange and cyan colors show an enlarged view of representative expression patterns of S100B and GFAP in the outer and inner layers, respectively (A). Scale bars, 100 μm for low-magnification images and 10 μm for insets (A). Individual dots represent the value of quantification for different sections (B). Box plots represent mean ± quantiles with whiskers for max and min (n = 3 specimens per age group; * p < 0.01, ** p < 0.001, *** p < 0.0001; Pairwise ANOVA with post-hoc Tukey HSD tests) (B).
(C) Schematic illustrations showing the human hippocampal formation colored by anatomical subregion (left panel) and summary of the proportion of GFAP+ cells among S100B+ cells in young and adult stages (middle two panels). Heatmap showing the percentage of GFAP+ cells among S100B+ cells in each subregion across ages (right panel).
See also Figure S2.
