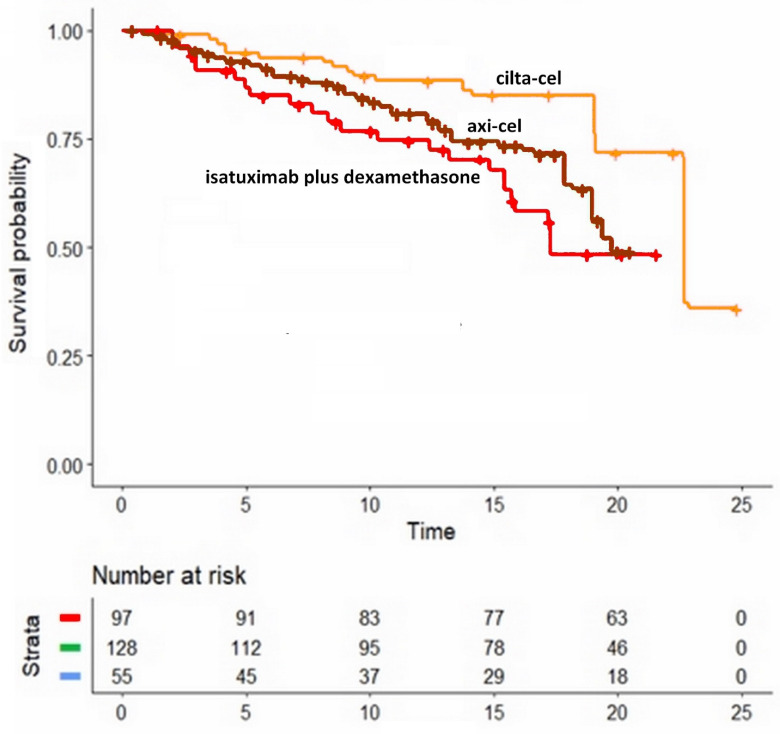
Figure 3.
Kaplan-Meier curves from reconstructed patient-level data. These three survival curves were obtained by reconstruction of individual patient data from three trials: ciltacabtagene autoleucel (CARTITUDE-1), idecabtagene vicleucel (KarMMa), and isatuximab plus desamethasone (NCT01084252). The cohort given ciltacabtagene autoleucel consisted of 97 patients, (CARTITUDE-1 N = 97); the cohort given idecabtagene vicleucel consisted of 128 patients, (KarMMa N = 128); and the cohort given isatuximab plus desamethasone consisted of 55 patients, (NCT01084252 N = 55). Symbols: isatuximab plus dexamethasone in red, ciltacabtagene autoleucel in orange, idecabtagene vicleucel in brown; time is expressed in months. The curve for isatuximab plus dexamethasone is reported to make this figure more easily comparable to Figure 2.

