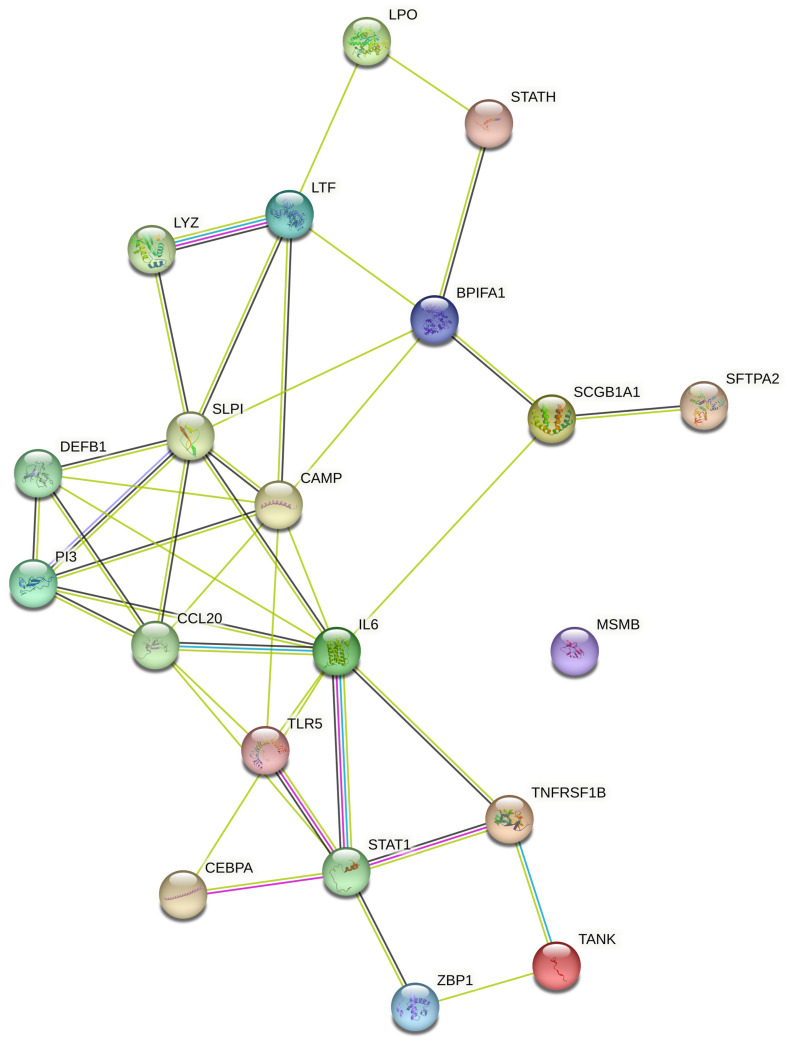
Figure 4.
Protein–protein interaction network generated using STRING database. Different-colored circles represent the different antimicrobial peptides while connecting lines represent various interactions between the studied AMPs. Peptide shows more than one type of interaction connected with multiple lines respectively.

