
Fig. 4. Phenotype landscapes and trajectories of differentiation of Db-Adpgk+ CD8+ T cells from mice.
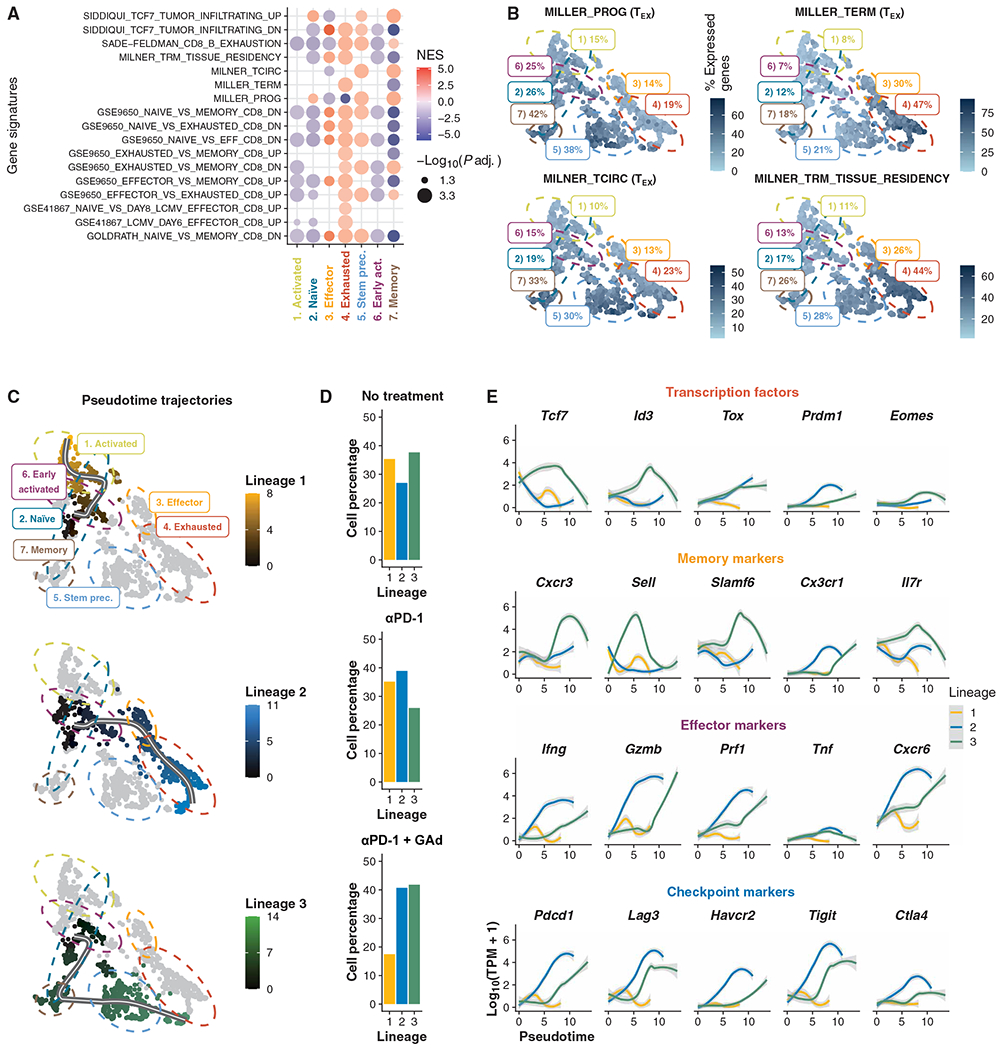
(A) GSEA of DE genes found in clusters (adjusted P ≤0.05). NES, normalized enrichment score. (B) Percentage of signature expression of TSTEM progenitors (MILLER_PROG.) and TEX CD8+ T cells (MILLER_TERM), core circulating (MILNER_TCIRC), and core tissue-resident memory T cell (MILNER_TRM_TISSUE_RESIDENCY) signatures (29, 32) in each cell. (C) Trajectory inference results shown as pseudotime projected onto UMAP. (D) Bar plots of cell percentages across experimental treatments for each lineage. (E) Locally weighted scatterplot smoothing of expression of transcription factors, memory, effector, and checkpoint markers along pseudotime trajectories.