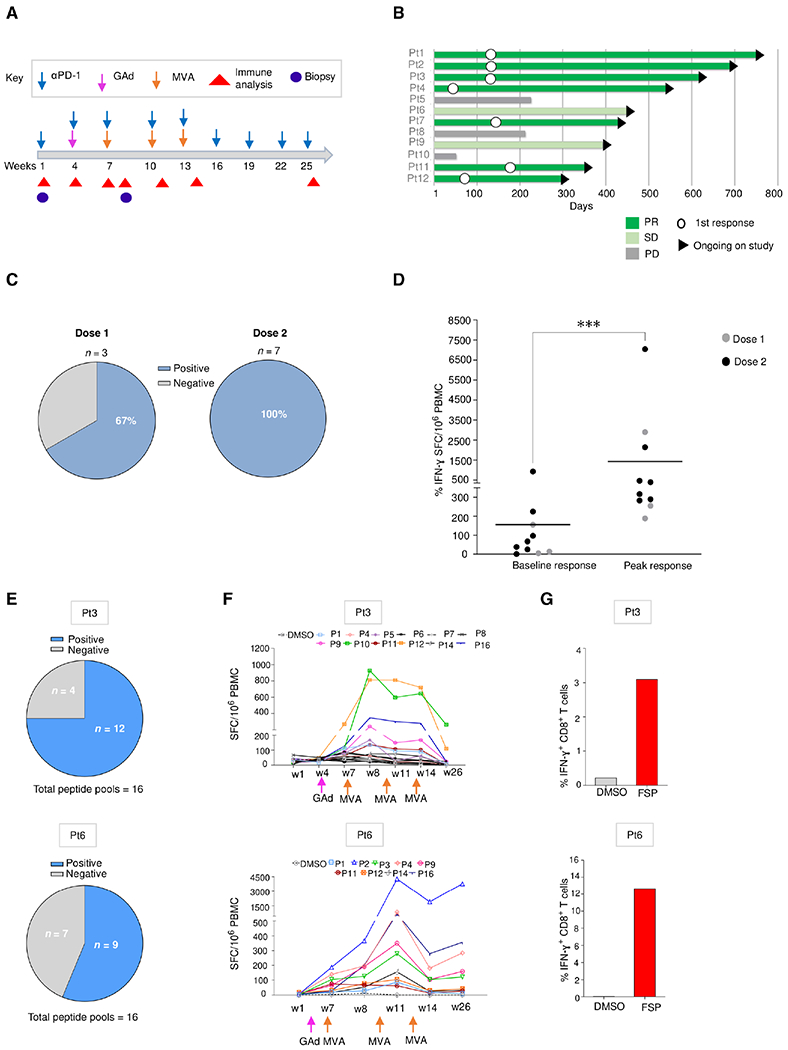
Fig. 6. Nous-209 vaccination elicits a strong and broad neoantigen-specific T cell response in patients with dMMR tumors.

(A) Clinical event timeline for 12 vaccinated patients (Pt) from baseline to the latest time point; treatments include αPD-1 combined with GAd and MVA vaccine prime boost administrations. (B) Clinical responses after treatment as assessed by tumor imaging per RECIST v1.1: response duration shown as a swimmer plot for tumor response over time. White circles indicate time of first response. The arrowheads on the right indicate continuing study treatment. (C and D) Immune responses measured in patients (n = 10) after Nous-209 vaccine by ex vivo IFN-γ. Immunogenicity was assessed by ex vivo IFN-γ ELISpot on peripheral blood mononuclear cells (PBMCs) stimulated with 16 pools of overlapping peptides covering the entire vaccine sequence. (C) Frequency of patients showing a positive response after vaccination and number of SFCs/million PBMCs corresponding to the sum of the responses to the single pools. Dot plot in (D) represents peak responses for each individual subject, compared with baseline prevaccination responses after pembrolizumab. Lines represent the mean of immune response. (E to G) Breadth of immune responses: number of FSP-positive pools (E), kinetic T cell responses measured by ex vivo IFN-γ ELISpot (F), and IFN-γ+ FSP-specific CD8+ T cells measured by intracellular staining (ICS) and flow cytometry after vaccination (G) are reported for patients 3 (dose 1) and 6 (dose 2).
