
Fig. 1 |. OPA1 is required for TH17 cell effector function.
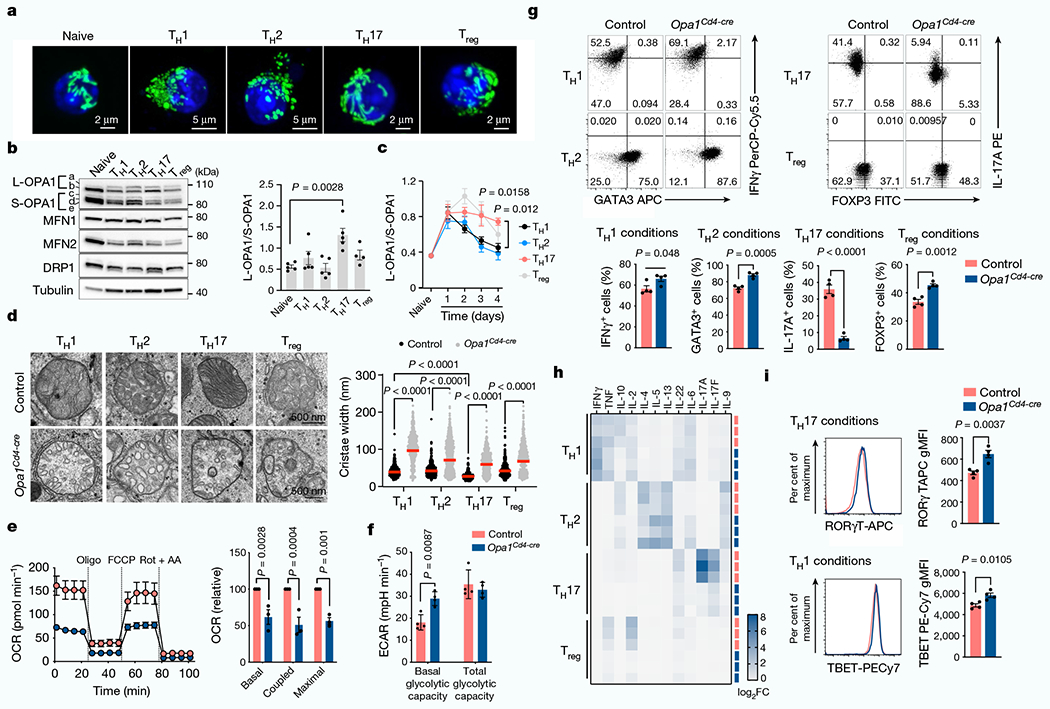
a, Representative live-cell spinning disk microscopy images showing mitochondria (GFP, green) and nuclei (Hoechst 42, blue) in CD4+ T cells from PhAM mice cultured in T helper (TH) and Treg cell conditions on day 4. Two separate experiments. b, Immunoblot of OPA1, MFN2, MFN1, DRP1 (left) and ratio of l- and s-OPA1 isoforms (right) in TN, TH and Treg T cells on day 4. Tubulin is used as a sample processing control. c, Kinetics of OPA1 isoforms during TH and Treg differentiation. In b,c, TH1, TH2 and TH17: n = 5 biological replicates, Treg: n = 4 biological replicates and 3 independent experiments. d, Electron microscopy (left) and width of mitochondrial cristae (right). Control TH1: n = 442, control TH2: n = 401, control TH17: n = 418, control Treg: n = 421, Opa1Cd4-cre TH1: n = 615, Opa1Cd4-cre TH2: n = 786, Opa1Cd4-cre TH17: n = 554 and Opa1Cd4-cre Treg: n = 433 cristae, and 3 biological replicates. Data are shown as individual measurements and geometric mean (red bar). e, Left, oxygen consumption rate (OCR) on addition of oligomycin (oligo), fluoro-carbonyl cyanide phenylhydrazone (FCCP) and rotenone plus antimycin A (Rot + AA) (n = 7 injections, 3 biological replicates). Right, baseline OCR, ATP-coupled respiration and maximal respiration (n = 3 independent experiments). f, Basal glycolytic rate and total glycolytic capacity (n = 4 biological replicates), measured by extracellular acidification rate (ECAR). g, Cells expressing IFNγ, 1L-17A, GATA3 and FOXP3 following restimulation (n = 4 biological replicates). The percentage of cells in each quadrant is indicated. h, Heat map of cytokine expression in the supernatant of indicated cells types, shown as log2 fold change (FC) (n = 3 biological replicates). i, TBET and ROR-γT expression (n = 4 biological replicates). gMFI, geometric mean fluorescence intensity. Representative plots and graphs summarize results of at least two independent experiments except where noted otherwise. Data in b,c,e-g,i are mean ± s.e.m. Two-sided Tukey’s test (b,d), Dunnett’s test (c), Šidak’s test (e,f) or unpaired two-tailed f-test (g,i). Exact P-values are indicated.