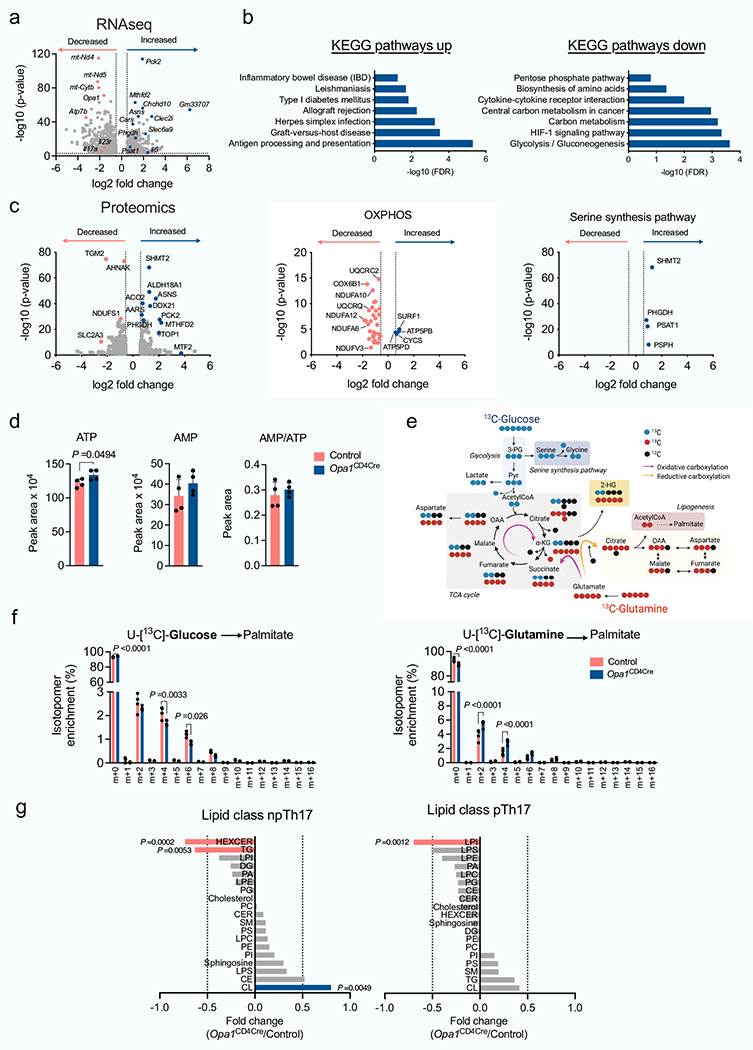
Extended Data Fig. 6 |. Multi-OMICS analysis of Th17 cells upon OPA1 deletion.

Control and Opa1CD4CTe CD4+ TN cells were cultured in Th17 conditions and the RNA extracted and sequenced. a) Volcano plot shows differentially expressed genes (1518: log10 P value < 3, log2 FC > 0.5). b) DAVID KEGG pathway analysis from differentially up- (779) or downregulated (739) genes (FDR, false discovery rate). c) Control and Opa1CD4Cre CD4+ TN cells were cultured in Th17 conditions and proteins from whole cell lysates extracted and analyzed (LC-MS). Left, volcano plot from differentially expressed proteins (562: log10 P value<1.3, log2 FC > 0.58). Middle and right volcano plots, protein expression in relation to OXPHOS and serine and glycine biosynthesis pathways, respectively. d) Cellular ATP, AMP and AMP/ATP ratio by LC-MS (n= 4 per genotype, day 4). e) Schematic of [U-13C]-Glucose and [U-13C]-Glutamine carbon allocation into central carbon metabolites. f) Fractional labelling of palmitate with [U-13C]-Glucose (left) or [U-13C]-Glutamine (right) in control and Opa1CD4Cre Th17 cells cultured 20 h on day 3 with fully labelled subsrates (n = 4 per group). g) Control and Opa1CD4ae CD4+ TN cells were cultured in Th17 conditions 4 days and lipids extracted and analyzed (n = 4 biological replicates). Graph, FC of distinct lipid classes in Opa1CD4Cre vs. control (HEXCER: hexosylceramide, TG: triacylglycerades, LPI: lysophosphatidylinositol, DG: diacylglycerol, PA: phosphatidic acid, LPE: lysophosphatidylethanolamine, PG: phosphatidylglycerol, Cholesterol, PC: phosphatidylcholines, CER: ceramides, SM: sphingomyelin, PS: phosphatidylserine, LPC: lysophosphatidylcholines, PE: phosphatidylethanolamine, PI: phosphatidylinositol, Sphingosine, LPS: lipopolysaccharide, CE: cholesterol esters, CL: cardiolipins). Transcriptomics, proteomics and lipidomics were performed once (a,b: n = 3; g: n = 4 biological replicates). Graphs summarize results of at least two independent experiments in d, f. Data are means ± s.e.m. Unpaired two-tailed t-test (a, c, d, f, g). Exact P values are indicated.
