
Extended Data Fig. 7 |. OPA1 controls chromatin accessibility in Th17 cells. a) CD4+ TN cells.
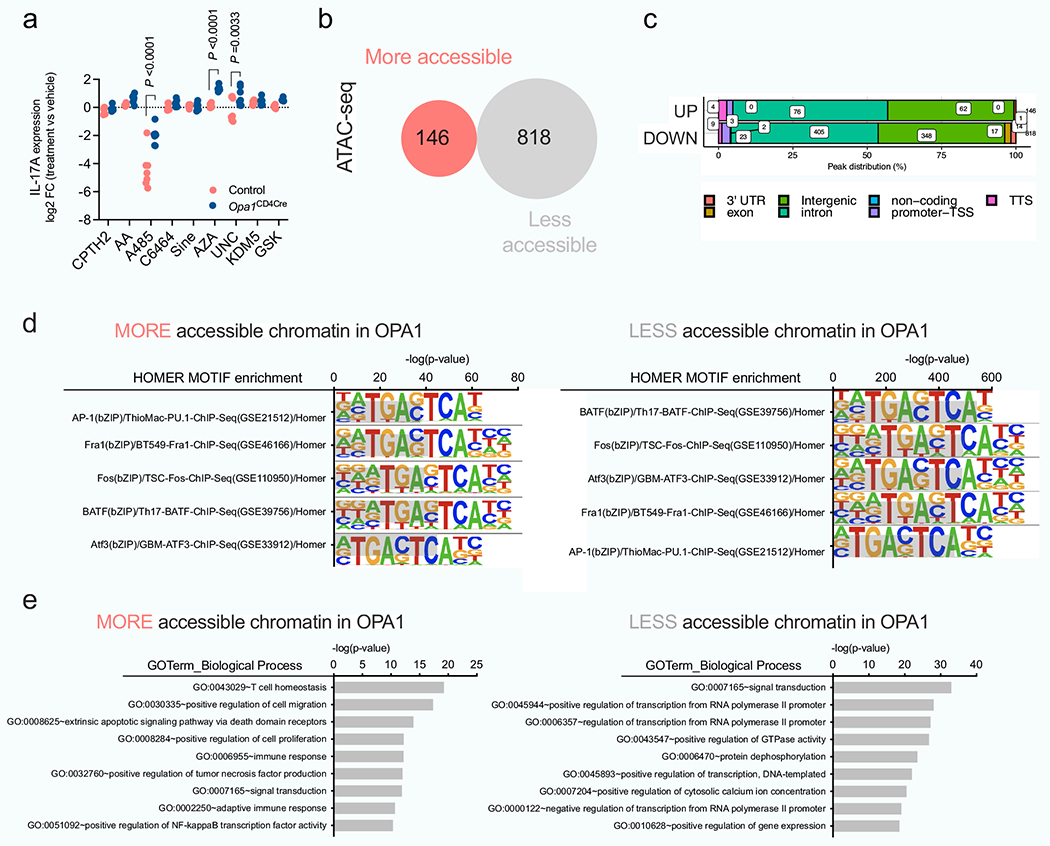
a) CD4+ TN cells from control and Opa1CD4Cre mice were cultured in Th17 conditions for 1 day followed by 48 h incubation with inhibitors for histone acetylation and methylation, and DNA methylation. IL-17A expression was analyzed by flow cytometry and results show log2 FC of IL-17A MFI in inhibitor-treated vs vehicle-treated cells (n = 7 biological replicates for all conditions except GSK: n = 4 biological replicates). Graph combines data from two independent experiments. Data are mean ± s.e.m. Two sided šidák’s test. Exact P values are indicated. b, c, d, e, CD4+ TN cells from control and Opa1CD4Cre mice were cultured in Th17 conditions 4 days and the DNA extracted and processed for ATAC-seq (n = 3 biological replicates). b) Number of differentially accessible chromatin regions (FC >2, p < 0.01). c) Genomic localization of the differentially regulated accessible chromatin regions. d) HOMER motif TF analysis on regulated chromatin regions. e) GO term pathway enrichment analysis from the differentially regulated accessible chromatin regions between Opa1CD4Cre and control Th17 cells (FC >2, p < 0.01).