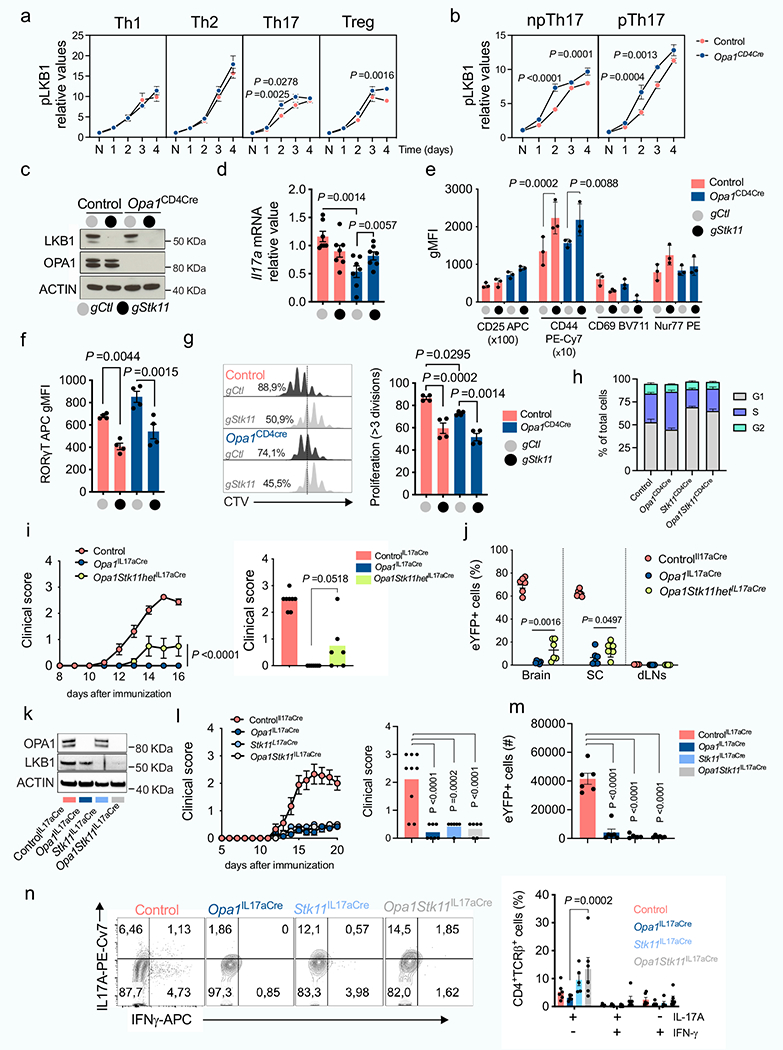
Extended Data Fig. 8 |. LKB1 deletion in OPA1 reestablishes IL-17A expression.

LKB1 phosphorylation kinetics in CD4+ TN cells cultured in Th and Treg (a) and np/p Th17 (b) conditions (Control: n = 4; Opa1CD4Cre: n = 3 biological replicates). c, d, e,f g, h Control and Opa1CD4Cre CD4+ TN cells transfected with Cas9 and indicated gRNAs. (c) Immunoblot for LKB1 and OPA1. ACTIN: loading control, (d) IL-17A mRNA expression (RT-PCR, n = 7), (e) CD25, CD44,CD69 and Nur77 expression (n = 3), (f) ROR-γT expression (n = 4), (g) cell proliferation (n = 4), (h) and cell-cycle analysis (n = 4, biological and transfection replicates). i) Left, clinical disease score upon MOG immunization and at day 16 (Right), (control: n = 8; Opa1IL17aCre: n = 7; and Opa1Stk11hetIL17aCre: n = 6 mice).j) CD4+TCRβ+eYFP+cell frequencies, day 20 post-immunization (n = 6 mice). k) Immunoblot for LKB1 and OPA1 in CD4+TCRβ+eYFP+ cells from control, Opa1IL17aCre, Stk11IL17aCre and Opa1Stk11IL17aCre mice. ACTIN: loading control. I) Left, clinical disease score upon MOG immunization and at day 16 (Right) (control: n = 9; Opa1IL17aCre: n = 7; Stk11IL17aCre: n = 6 and Opa1Stk11IL17aCre: n = 6 mice). m) CD4+TCRβ+eYFP+ SC cell numbers (n = 6 mice per genotype except Stk11IL17aCre: n = 5 mice) and n) IL-17A and IFN-γ expression, day 20 postimmunization (control: n = 6 mice; Opa1IL17Cre: n = 5 mice; Stk11IL17Cre: n = 5 mice; Opa1Stk11IL17Cre: n = 6 mice). Representative plots and graphs summarize results of at least two independent experiments, except noted otherwise. Data are means ± s.e.m. Two-sided šidák’s test (a, b, h, n) or Tukey’s test (d, e, f, g, i, j, l, m) . Exact P values are indicated.
