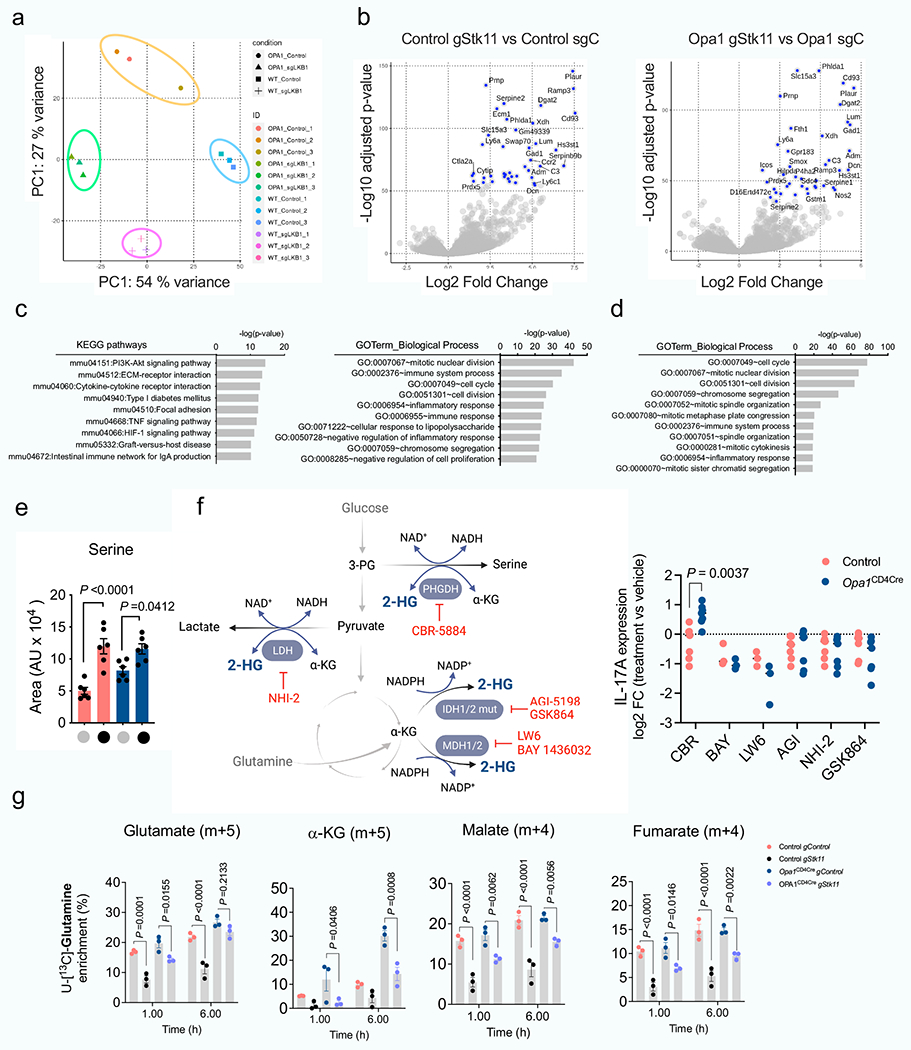
Extended Data Fig. 10 |. LKB1 couples TCA cycle and serine metabolism to Th17 effector function.

a) Principal component analysis (PCA) of the transcriptome of control and Opa1CD4Cre CD4+ TN cells transfected with Cas9 and indicated gRNAs, cultured 4 days in Th17 conditions (n = 3 biological and transfection replicates). b) Volcano plots of the differentially expressed genes (DEG, FC > 1, p-value < 0.001) for the comparisons: control gStk11 vs. control gCtl (left) and Opa1CD4CregStk11 vs. Opa1CD4CregCtl (right). Blue dots annotate the highest 40 DEG. c, d, KEGG pathway and Gene Ontology (GO) annotation analysis from DEG (FC>1, p-value<0.001) between (c) control gStk11 vs. control gCtl or (d) Opa1CD4CregStk11 vs. Opa1CD4CregCtl. e) Intracellular serine in control and Opa1CD4Cre CD4+ TN cells transfected with Cas9 and indicated gRNAs (n = 6 transfection replicates, 2 independent experiments) by LC-MS. f) Left, schematic shows 2-HG production from primary and promiscuous enzymatic reactions and the inhibitors used for targeting its production. Right, CD4+ TN cells from control and Opa1CD4Cre mice were cultured under Th17 conditions for 1 day followed by 48 h inhibitor treatment. IL-17A expression was analyzed by flow cytometry in restimulated cells and expressed as log2 FC inhibitor-treated vs. vehicle-treated cells (CBR, AGI, NHI-2, GSK864: n = 7 per group; BAY, LW6: n = 3 per group). Graph summarizes data from 2 experiments. g) Kinetics of fractional labelling of glutamate (m + 5), α-ketoglutarate (m + 4), malate (m + 4) and fumarate (m+4) in control and Opa1CD4Cre CD4+ T cells transfected with Cas9 and indicated gRNAs cultured for 4 days in Th17 conditions and incubated with [U-13C]-Glutamine for the indicated times (n = 3 biological and transfection replicates). Data are means ± s.e.m. Two-sided šidák’s test (f) or Tukey’s test (e, g). Exact P values are indicated.
