
Fig. 3 |. OPA1 modulates the TCA cycle and 2-HG for epigenetic control of TH17 cell function.
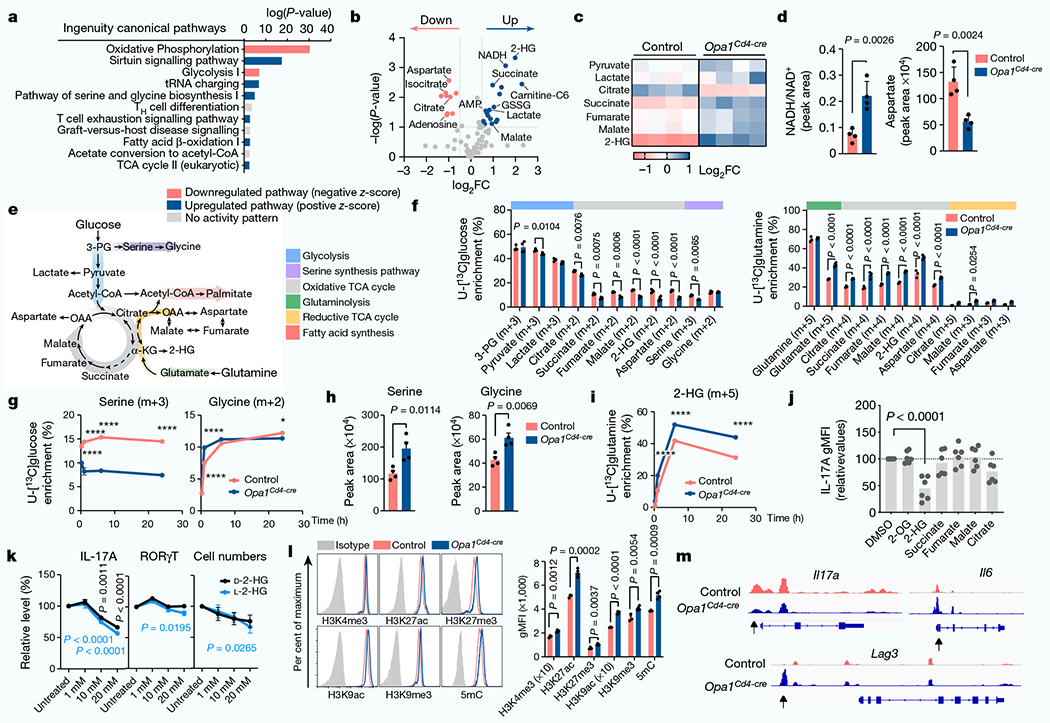
a, ingenuity pathway analysis of differentially regulated proteins (Opa1Cd4-creversus control TH17 cells; log10(P-value<1.3, log2FC >0.58)). b, Volcano plot of metabolite levels determined by liquid chromatography–mass spectrometry (LC-MS) analysis. The plot shows metabolites that are increased (blue) or decreased (red) in Opa1Cd4-cre versus control TH17 cells; FC>0.5 and log10(P-value) > 1. GSSG, oxidized glutathione. c, Heat map showing metabolite levels (log2FC) in control and Opa1Cd4-cre TH17 cells. d, Cellullar NADH/NAD+(left) and aspartate (right), determined by LC–MS. e, Schematic of central carbon metabolism. 3-PG, 3-phosphoglycerate; OAA, oxaloacetate. f, Fractional labelling of metabolites in TH17 cells cultured for 20 h with fully-labelled U-[13C]glucose on day 3 (left, n = 4 biological replicates per group) or U-[13C]glutamine (right, control: n = 3, Opa1Cd4-cre: n = 4 biological replicates). Colours along the top of the graph correspond to the scheme in e. g, Fractional labelling of serine and glycine from U-[13C]glucose. h, intracellular serine and glycine levels, determined by LC–MS. i, Fractional labelling of 2-HG from U-[13C]glutamine. j, IL-17A expression in CD4+ T cells cultured for 4 days in TH17 conditions after overnight treatment with metabolites (n = 6 biological replicates, 2 independent experiments). 2-OG, 2-oxoglutarate. k, Cell numbers (n = 7 biological replicates) and cytokine and transcription factor expression (n = 8 biological replicates) in cells cultured for 3 days in TH17 conditions with D-2-HG (black) or L-2-HG (blue) for the last 48 h, 2 independent experiments. I, Acetylation and methylation status of histone H3 lysine 4 (H3K4), lysine 9 (H3K9) and lysine 27 (H3K27) and DNA methylation. 5mC, 5-methylcytosine. m, Accessible chromatin regions as indicated by ATAC-seq. Representative plots and graphs summarize results of at least two independent experiments. Arrows indicate differentially accessible chromatin regions. a,g,i, n = 3 biological replicates. b–d,h,l, n = 4 biological replicates. Data in d,f–l are mean±s.e.m. Two-sided šidák’s test (f,g,i,k), Dunnett’s test (j) or unpaired two-tailed t-test (d,h,l). Exact P-values are indicated. *P<0.05, ****P<0.0001.