
Fig. 4 |. LKB1 couples TCA cycle and de novo serine metabolism for 2-HG production.
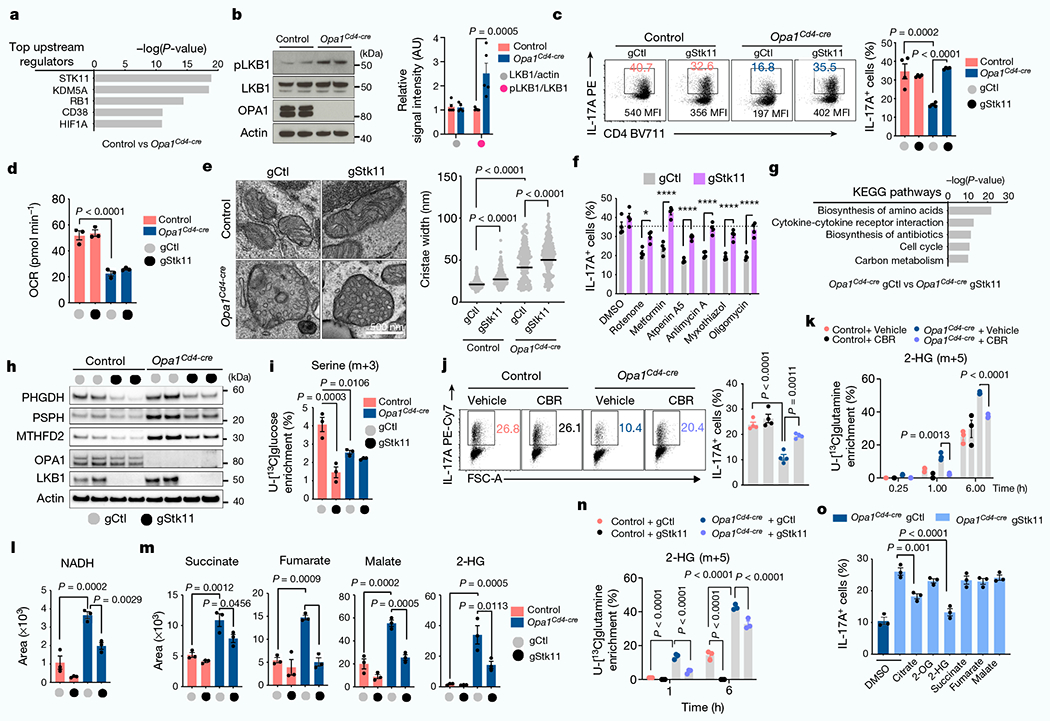
a, Top upstream regulators of differentially regulated proteins (Opa1Cd4-cre versus control TH17 cells; log10(P-value < 1.3, log2FC > 0.58, Ingenuity pathway analysis)). b, Immunoblot (left) and quantification (right) of LKB1 phosphorylation and expression (n = 5 biological replicates, 2 independent experiments). Actin is used as a sample processing control. c, 1L-17A expression in T cells transfected with Cas9 and indicated guide RNAs (gRNAs). gCtl, control guide RNA; gStk11, Stk11-targeting guide RNA. d, Basal OCR. e, Electron microscopy image (left) and width of mitochondrial cristae (right) (control gCtl: n = 214; control gStk11: n = 271, Opa1Cd4-cre gCtl: n = 236; Opa1Cd4-cre gStk11: n = 257 cristae, 3 biological replicates). Data are shown as individual measurements and geometric mean (black bar). f, 1L-17A expression in T cells transfected with Cas9 and indicated gRNAs, cultured in TH17 conditions for four days and treated overnight as indicated. g, Kyoto Encyclopedia of Genes and Genomes (KEGG) pathway annotation of differentially expressed genes (Opa1Cd4-cre gStkll versus Opa1Cd4-cre gCtl, P <0.001, log2FC > 1). h, Immunoblot in TH17 cells transfected with Cas9 and indicated gRNAs. Two replicate transfections shown . i, Detection of serine (m+3) in cells cultured for 6 h with U-[13C]glucose. j, 1L-17A expression in cells treated for 20 h with CBR-5884 on day 2. k, Detection of 2-HG (m+5) fractional labelling from U-[13C]glutamine. l,m, Intracellular NADH (l), succinate, fumarate, malate and 2-HG (m) detection by LC-MS. n, 2-HG (m+5) in cells cultured with U-[13C]glutamine. o, 1L-17A expression in Opa1Cd4-cre T cells transfected with Cas9 and indicated gRNAs, cultured in TH17 conditions for four days and treated overnight as indicated. Representative plots and graphs summarize results of at least two independent experiments, except where noted otherwise. Data a,d,e,g,i,k-o: n = 3 biological replicates per group; c,f,j: n = 4 biological replicates per group. Data in b–d,f,i–o are mean ± s.e.m. Two-sided šidák’s test (b,f), Tukey’s test (c‘e,i‘n) or Dunnett’s test (o). Exact P-values are indicated.