
Extended Data Fig. 1 |. Mitochondrial membrane remodeling in CD4+TN cells under T-helper (Th) and regulatory (Treg) conditions in vitro and in vivo.
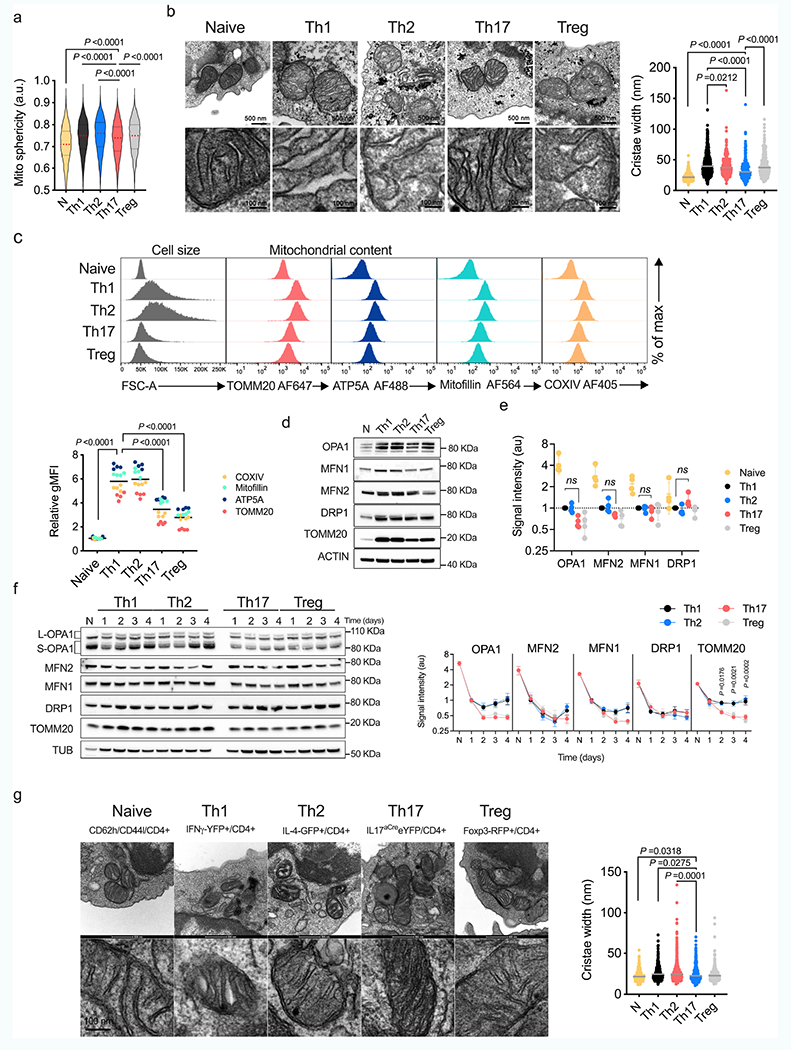
a) Mitochondrial sphericity In live cell spinning disk microscopy images In CD4+ TN cells (PhAM mice) cultured in Th and Treg conditions (TN: n = 1673, Th1: n = 8406, Th2: n = 5485, Th17: n = 7672 and Treg: n = 4824 segmented objects (mitochondria), 2 independent experiments. Violin plot shows median with quartiles. b) EM images (left) and cristae width (right) in TN cells cultured in Th and Treg conditions (TN: n = 362, Th1: n = 479, Th2: n = 369, Th17: n = 319, and Treg: n = 294 cristae, 3 biological replicates). (c) Intracellular expression in TN, Th and Treg cells (n = 4 biological replicates). Representative graph summarize results of two independent experiments. d) Immunoblot of CD4+ TN, Th and Treg cells, day 4, representative experiment out of two. ACTIN: sample processing control (e) Quantification of protein levels from immunoblots as in Fig. 1b (n = 4 biological replicates, 2 independent experiments). f) Immunoblot of proteins that control mitochondrial dynamics in CD4+ TN cells cultured for the indicated times in Th and Treg conditions. TUBULIN: sample processing control. Right, protein levels (n = 4 biological replicates, 2 independent experiments). g) EM images (left) and cristae width (right) in CD4+ TN and effector T cells from reporter mice subjected to immune challenges (naive: n = 410, Th1: n = 262, Th2: n= 675, Th17: n = 461 and Treg: n = 402 cristae, 3 mice per condition). Data b, g are geometric mean, c mean and e, f means ± s.e.m. Two-sided Tukey’s test (b) or Dunnett’s test (a, c, e, f, g). Exact P values are indicated.