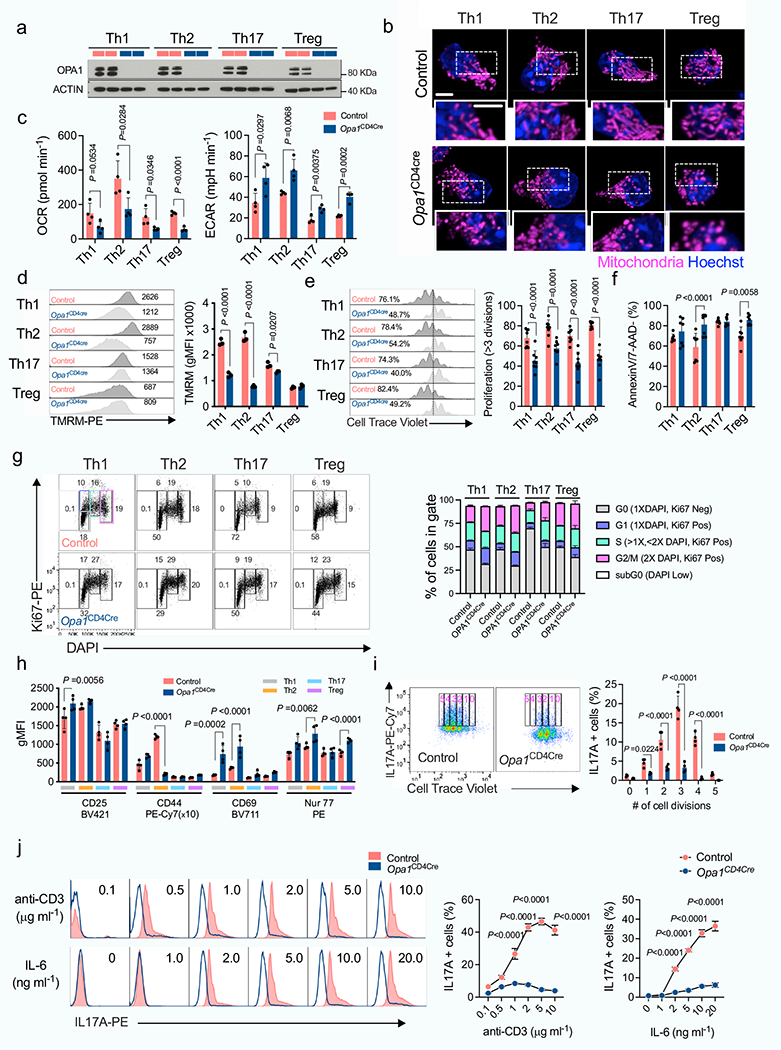
Extended Data Fig. 2 |. Mitochondrial dysfunction and proliferation defects in Opa1CD4cre T cells.

CD4+ TN cells from control and Opa1cd4cre mice were cultured 4 days in Th and Treg conditions. a) Immunoblot for OPA1 at the end of the culture (2 biological replicates per condition shown). ACTIN: loading control. b) Spinning disk microscopy images from mitochondria (MitoTracker Deep Red, purple) and nuclei (Hoechst, blue). Scale bar: 2 μm. Representative images from 3 biological replicates. c) Baseline OCR (left) and ECAR (right) (n = 4 biological replicates). d) Mitochondrial membrane potential determined by Tetramethylrhodamine methyl ester (TMRM) (n = 3 biological replicates) e) Cell proliferation, day 3 (n = 8 biological replicates, 2 independent experiments). f) Cell viability determined by 7-aminoactinomycin D (7-AAD) and annexin-V staining, day 4 (n = 7 biological replicates, 2 independent experiments). g) Cell-cycle analysis determined by Ki-67 and DAPI staining (n = 3 biological replicates). h) Surface expression of CD25, CD44 and CD69, and intracellular expression of Nur77 in CD4+ TN cells from control and Opa1CD4Cre mice cultured 3 days in Th and Treg conditions (n = 4 biological replicates). i) IL-17A expression and proliferation in control and Opa1CD4Cre Th17 cells, day 3. Graph shows IL-17A expression per each cell division state gated on live CD4+ T cells (n = 4 biological replicates).j) IL-17A expression in CD4+ TN cells cultured in Th17 conditions with increasing concentration of plate bound anti-CD3 or IL-6 for three days and restimulated (n = 4 biological replicates). Representative plots and a graph summarizing the results of at least two independent experiments are shown, except where noted otherwise. Data are means ± s.e.m. Two-sided šidák’s test (d, e, f, h, i, j) or unpaired two-tailed t-test (c). Exact P values are indicated.
