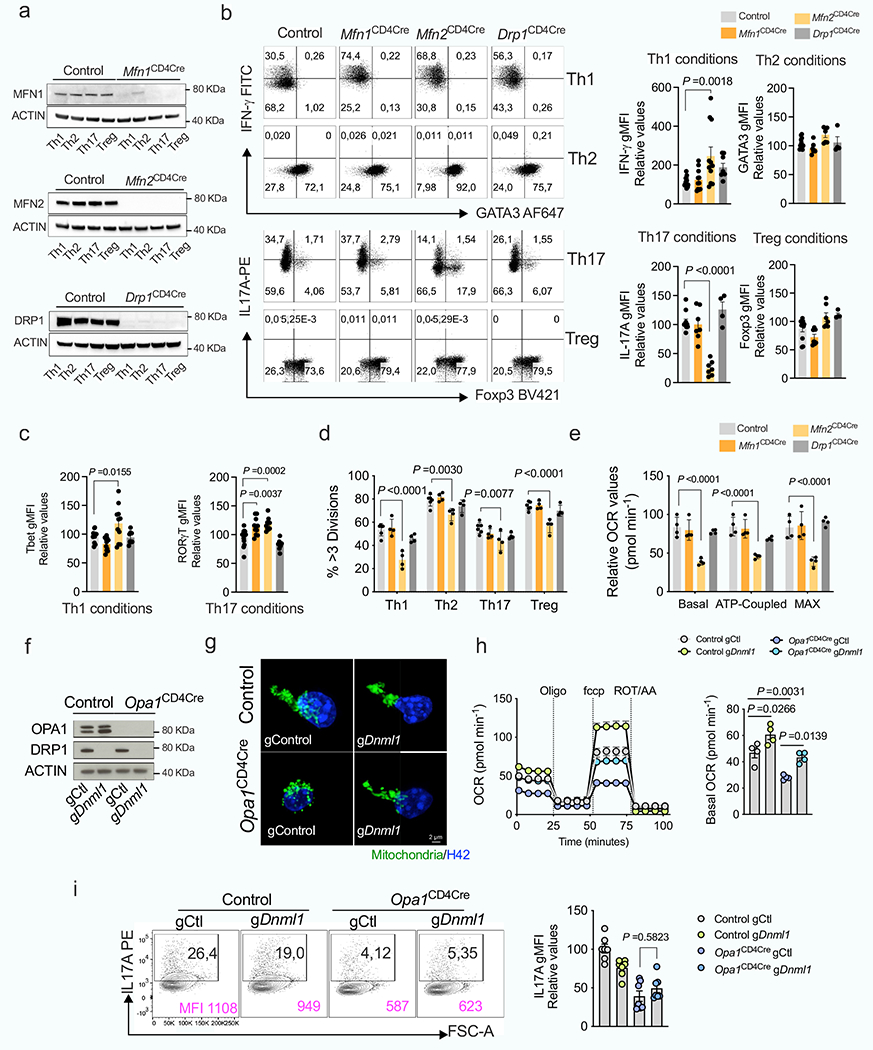
Extended Data Fig. 3 |. Role of inner and outer MM remodeling in IL-17A production.

Mfn1, Mfn2 or Dnml1 floxed mice were crossed with CD4Cre mice (Mfn1CD4Cre, Mfn2CD4Cre and Drp1CD4Cre). a, b, c, d, e, CD4+ TN cells across genotypes were cultured in Th and Treg conditions. a) Immunoblot of MFN1, MFN2 and DRP1 in a representative experiment out of two. ACTIN: loading control. b) Cytokine and TF expression in Th- and Treg-reestimulated cells across genotypes (Th1 conditions: Control n=15; Mfn1, Mfn2 n =11; Drp1 n =8; Th2, Th17 and Treg conditions; Control n =11; Mfn1, Mfn2 n =7; Drp1 n =4, biological replicates). c) Intracellular levels of T-bet and ROR-γt (Control n = 15; Mfn1CD4Cre n =11; Mfn2CD4Cre n =11; Drp1CD4Cre n =8, biological replicates). d) Proliferation as determined by Cell Trace Violet dilution staining (n = 4 biological replicates, except control; n = 6). e) Relative baseline OCR, ATP-coupled respiration, and maximal respiration in Th17 cells across genotypes (n = 4 biological replicates per group).f, g, h, i, Control and Opa1CD4Cre CD4+ TN cells were transfected with Cas9 and indicated gRNAs. f) Immunoblot for DRP1 and OPA1. ACTIN: loading control. g) Representative spinning disk confocal images from mitochondria (Mitotracker Deepred, green) and nuclei (Hoechst, blue) from 3 biological and transfection replicates. h) OCR upon oligomycin (Oligo), fccp and rotenone + Antimycin A (ROT+AA) addition (left) and relative baseline OCR (right) (n =4 biological and transfection replicates). i) Intracellular IL-17A expression (n =7 biological and transfection replicates). Representative plots and a graph summarizing the results of at least two independent experiments are shown, except where noted otherwise. Data are means ± s.e.m. Two-sided Tukey’s test (b, c, d, e, h, i). Exact P values are indicated.
