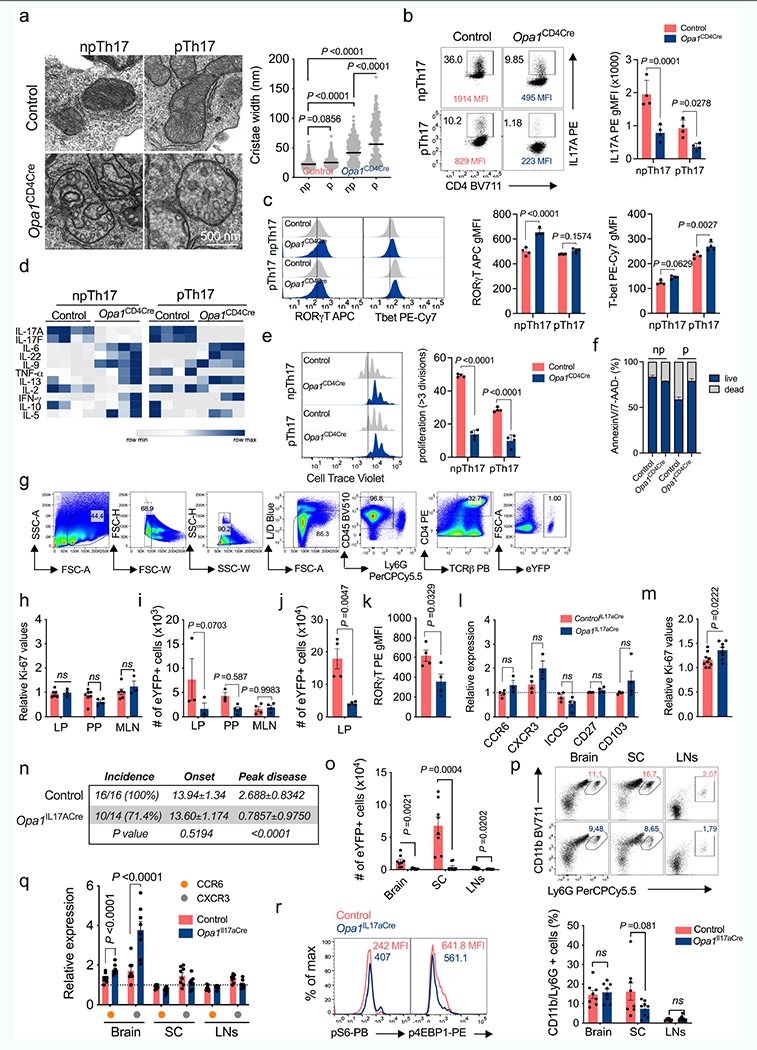
Extended Data Fig. 4 |. OPA1-requirement for IL-17A expression across cell culture and in vivo conditions.

TN cells cultured in Th17 non-pathogenic (np) and pathogenic (p) conditions. a) EM images and cristae width (Control np: n = 528, p: n = 343; Opa1CD4Cre np: n = 321, p: n = 267 cristae, 3 biological replicates). Graph shows geometric mean, black. (b) Cytokine (c) TF expression, d) supernatant cytokines, and e) proliferation, n = 4 biological replicates. f) Cell viability (n = 8, 2 independent experiments). g) Gating strategy to identify CD4+TCRβ+eYFP+ (Th17) cells. h) Ki-67 expression in LP Th17 cells (Control: n = 6; Opa1IL17aCre: n = 3), PP (Control: n = 7; Opa1IL17aCre: n = 4) and MLN (Control: n = 6; Opa1IL17aCre: n = 3), 2 independent experiments. i) Th17 cell numbers (LP: n = 3; PP; Control: n = 3; Opa1IL17aCre: n = 4, MLN: n = 4). Mice were anti-CD3 immunized.j) LP Th17 cell numbers (n = 4), k) ROR-γT expression (n = 4), l) surface expression (CCR6, CXCR3: Control: n = 4; Opa1IL17aCre: n = 3; ICOS, CD27, CD103: n = 4) and m) Ki-67 levels (Control: n = 9; Opa1IL17aCre: n =8, 2 independent experiments). Mice were MOG immunized. n) Disease incidence, onset and peak disease (days, controlIL17aCre: n = 16; Opa1IL17aCre: n = 14, 2 independent experiments. o) Cell numbers (n = 8). p) Neutrophil percentage (CD45+CD11b+Ly6G+, n = 8). q) CCR6 and CXCR3 levels (n = 8). r) Phosphorylated S6 and 4E-BP1 (CD4+TCRβ+eYFP+cells). Plots and graphs summarize results of at least two independent experiments, except noted otherwise. Data are means ± s.e.m. Two-sided Tukey’s test (a) or šidák’s test (b, c, e, i, l, q) or unpaired two-tailed t-test (h, j, k, m, o, p). Exact P values are indicated.
