
Extended Data Fig. 5 |. Th17 cells rely on OPA1 independent of metabolic activity.
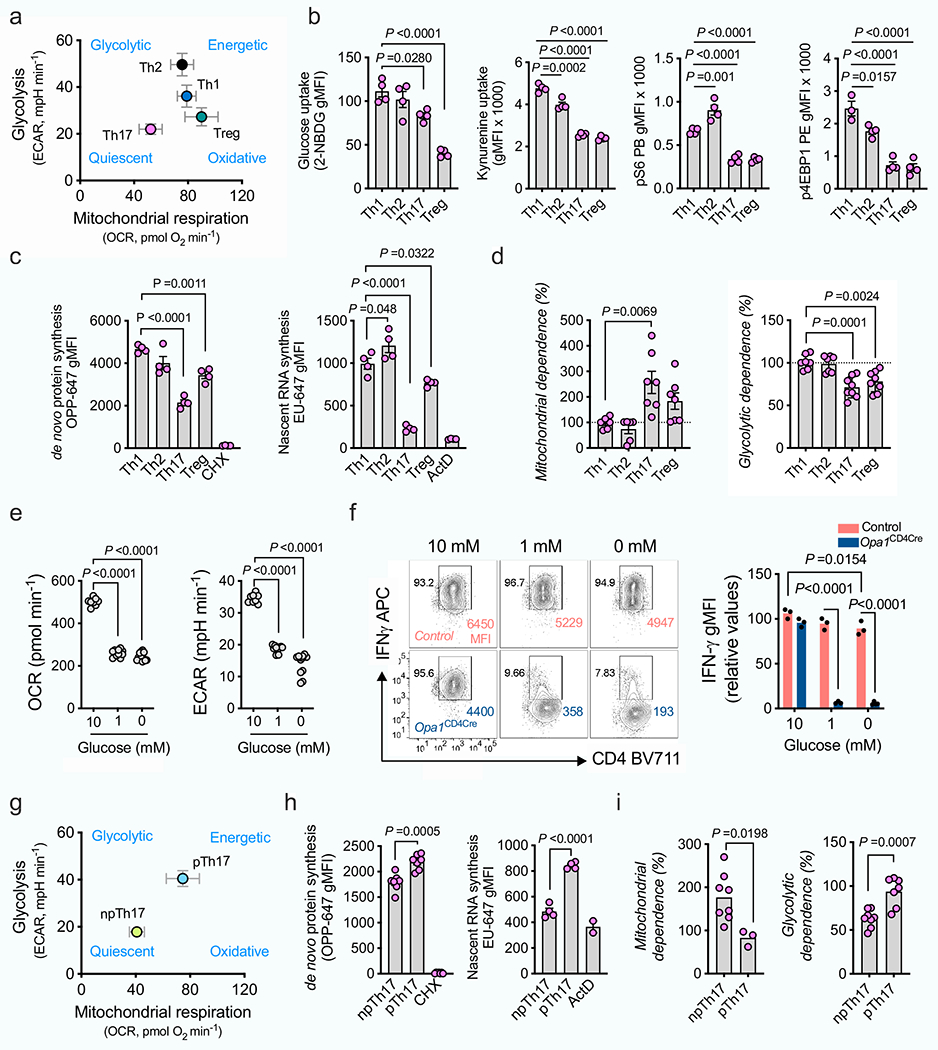
a, b, c, d, CD4+ TN cells were cultured in Th and Treg conditions.
a) Bioenergetic profile (baseline OCR/ECAR, n = 4 independent experiments). b) Glucose and kynurenine uptake, phosphorylated S6 (n = 4) and 4E-BP1 (Th1: n = 3, Th2,Th17,Treg: n = 4 biological replicates). c) de novo protein and nascent RNA synthesis by O-propargyl puromycin (OPP) and ribonucleoside ethynyl uridine (EU) incorporation, respectively (n = 4 biological replicates). Cyclohexamide (CHX) and actinomycin D (ActD): negative controls. d) Protein translation dependence on mitochondria (left, Th1, Th2: n = 6; Th17,Treg: n = 7 biological replicates) or glycolysis (right, Th1, Th2: n = 7: Th17, Treg: n = 8 biological replicates), 2 independent experiments. (e) OCR and ECAR (10 mM: n = 8; 1 mM and 0 mM n = 4 biological replicates) and (f) IFN-γ expression (n = 3 biological replicates) in cells cultured in Th1 conditions 3 days before overnight culture in RPMI with 10% non-dialyzed FBS and decreasing glucose concentrations. g, h, i, CD4+ TN cells cultured in Th17 np/p conditions. g) Bioenergetic profile (n = 4 biological replicates). h) de novo protein synthesis (left, n = 7 biological replicates, 2 independent experiments) and nascent RNA synthesis (right, np/p: n = 4, ActD: n = 2 biological replicates). i) Protein translation dependence on mitochondria (left, np: n = 8: p: n = 3 biological replicates) or glycolysis (right, np: n = 8: p: n = 7 biological replicates, 2 independent experiments). Representative plots and graphs summarize results of at least two independent experiments, except where noted otherwise. Data are means ± s.e.m. Two-sided Tukey’s test (b–e), šidák’s test (f) or unpaired two-tailed t-test (h, i). Exact P values are indicated.