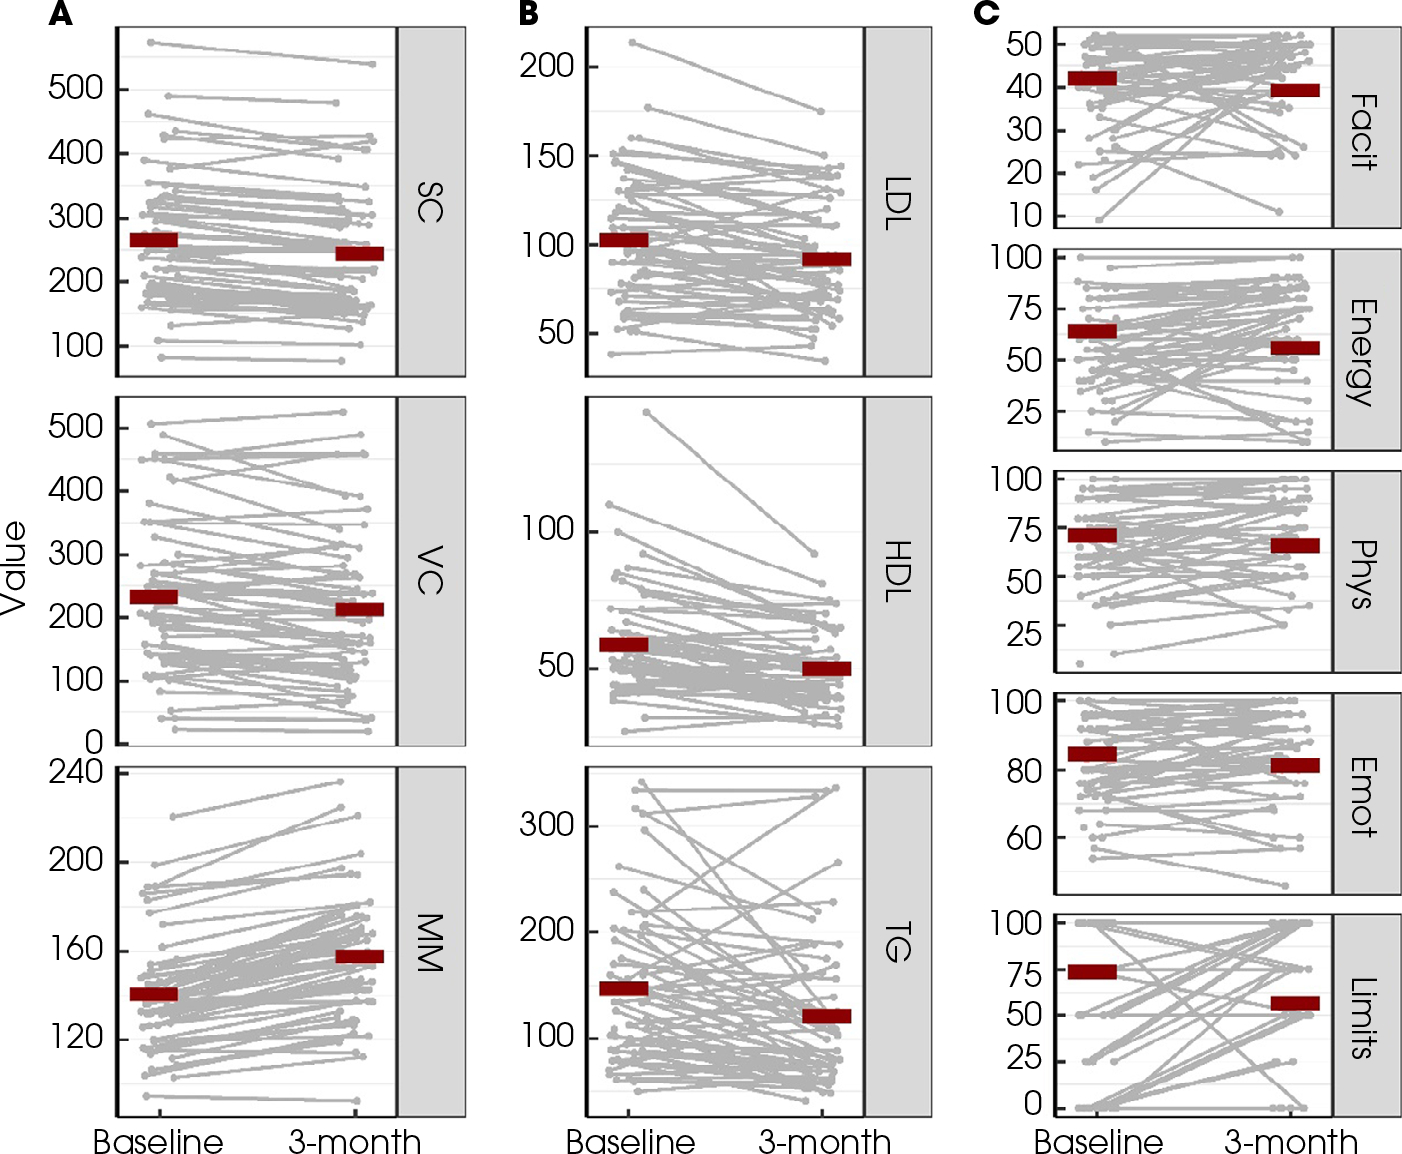
Fig. 1.

Overview of measurements at baseline and at 3-month follow-up after BAT for (A) body composition outcomes: subcutaneous (SC) fat, visceral (VC) fat, and muscle mass (MM); (B) lipid outcomes: LDL, HDL and TGs; (C) quality-of-life outcomes: FACIT-Fatigue scale (Facit), Energy, Physical Functioning (Phys), Emotional well-being (Emot), and Limitations due to physical health (Limits). Red lines indicated the corresponding mean values. Measurements from the same individual were connected with grey lines.
