Fig. 2.

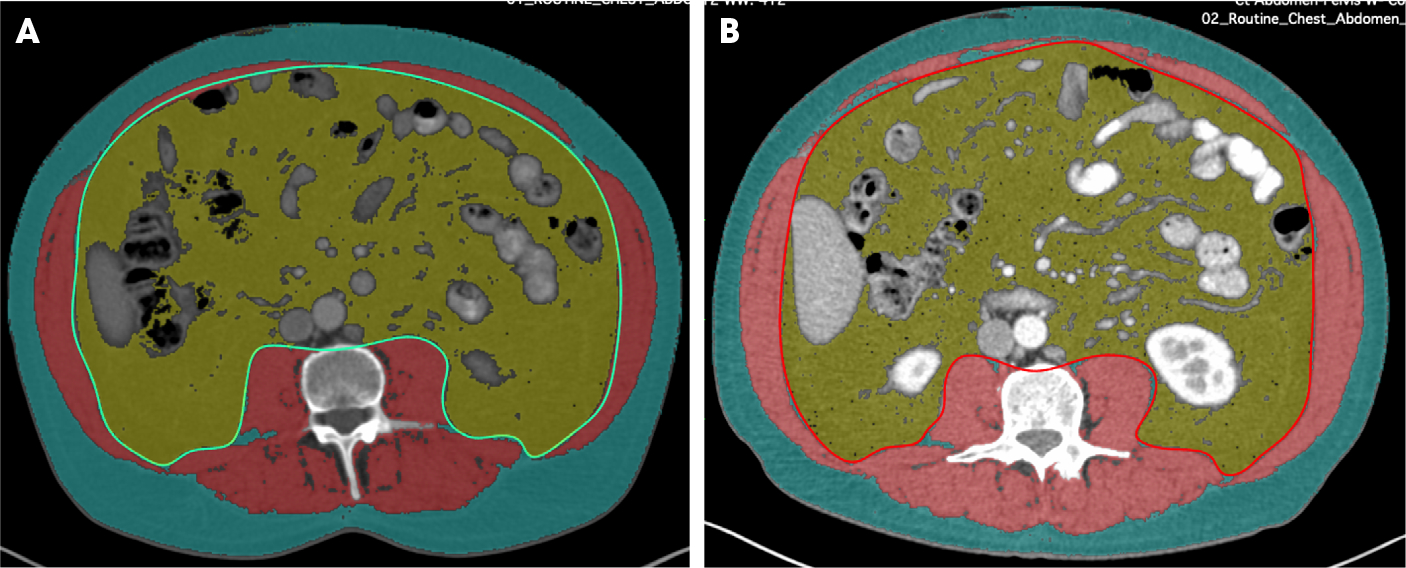
Image of CT abdomen at L3 vertebral level with segmentation of visceral fat (yellow area), subcutaneous fat (blue area) and abdominal wall musculature (red area) performed manually with OsiriX at 3-month interval between the two scans (A,B).

Image of CT abdomen at L3 vertebral level with segmentation of visceral fat (yellow area), subcutaneous fat (blue area) and abdominal wall musculature (red area) performed manually with OsiriX at 3-month interval between the two scans (A,B).