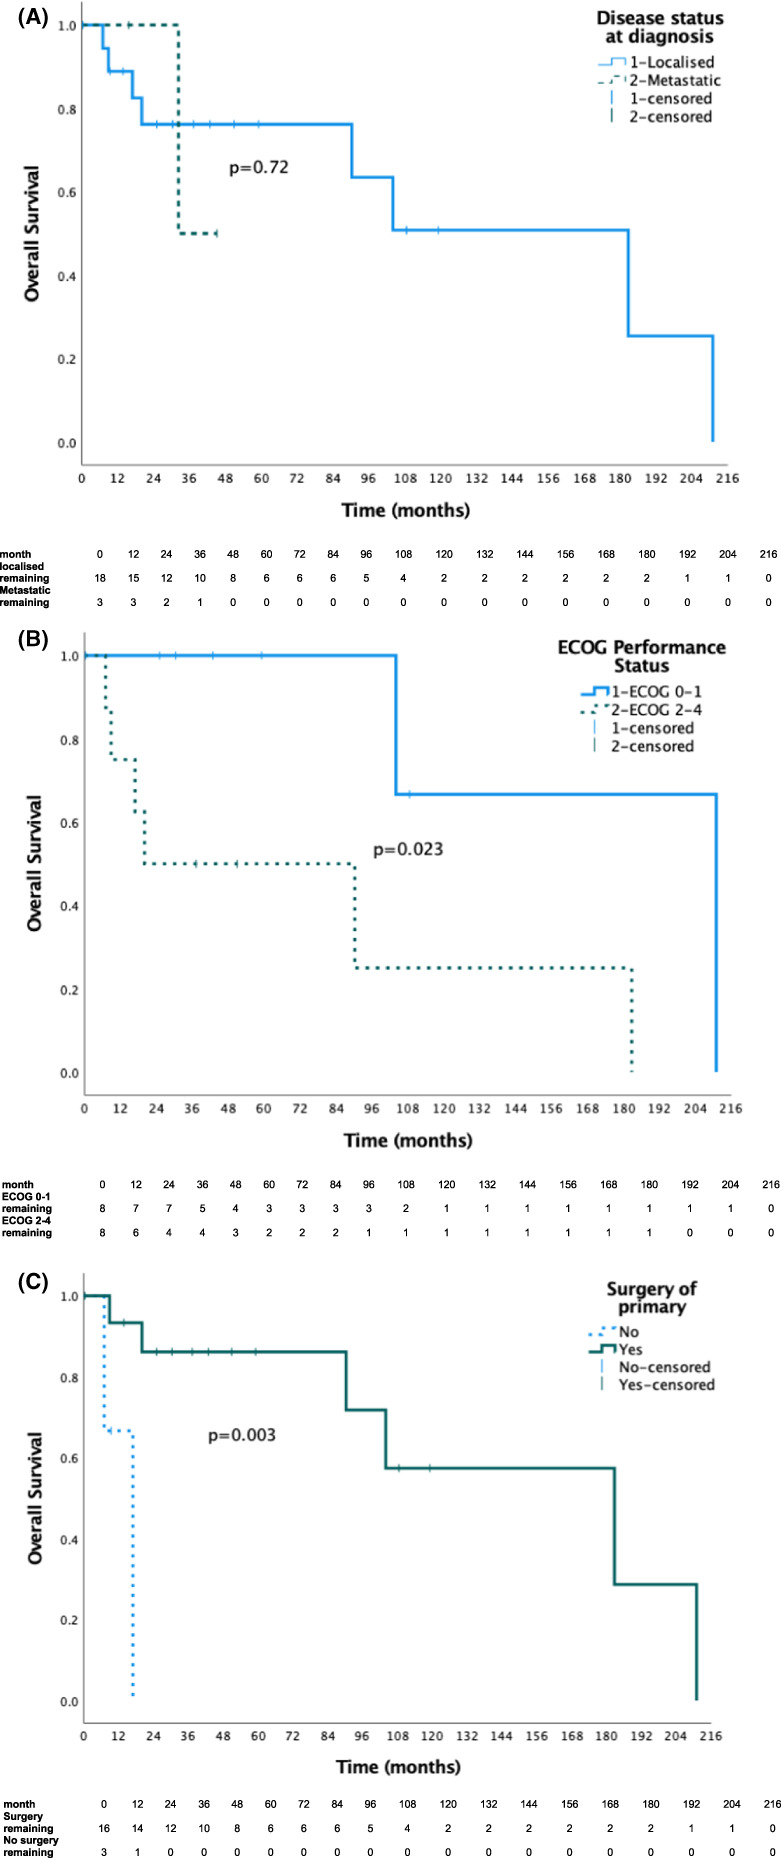
FIGURE 2.

(A) This Kaplan–Meier curve illustrates the overall survival of Australian patients with mesenchymal chondrosarcoma by localised or metastatic disease status at diagnosis. (B) This Kaplan–Meier curve illustrates the overall survival in Australian patients with localised mesenchymal chondrosarcoma by ECOG group 0–1 compared to 2–3. (C) This Kaplan–Meier curve illustrates the overall survival in Australian patients with localised mesenchymal chondrosarcoma by surgical resection of the primary tumour.
