
FIGURE 7.
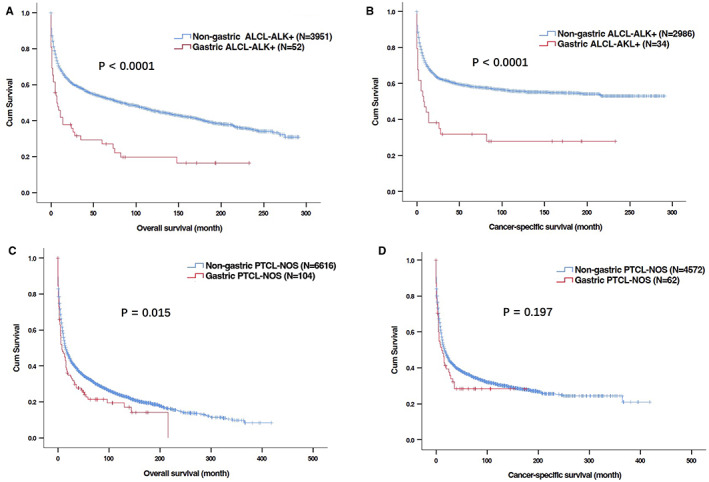
Kaplan–Meier curves for overall survival (OS) and cancer‐specific survival (CSS) in patients with primary gastric T‐cell lymphoma (PG‐TCL) and non‐gastric T‐cell lymphoma in SEER database. (A, B) OS (A) and CSS (B) of patient with primary gastric anaplastic large T‐cell lymphoma, anaplastic lymphoma kinase + (ALCL‐ALK+) and non‐gastric ALCL‐ALK (+); (C, D) OS (C) and CSS (D) of patient with primary gastric peripheral T‐cell lymphoma, not otherwise specified (PTCL‐NOS) and non‐gastric PTCL‐NOS.