
FIGURE 6.
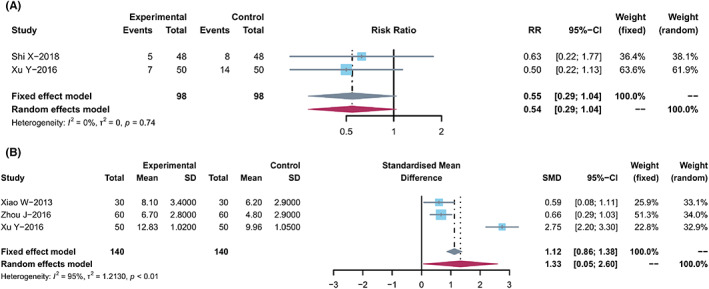
Transfer rate and TTP. (A) Forest plot displaying the results of the meta‐analysis for transfer rate. (B) Forest plot displaying the results of the meta‐analysis for TTP.
Official websites use .gov
A
.gov website belongs to an official
government organization in the United States.
Secure .gov websites use HTTPS
A lock (
) or https:// means you've safely
connected to the .gov website. Share sensitive
information only on official, secure websites.
Transfer rate and TTP. (A) Forest plot displaying the results of the meta‐analysis for transfer rate. (B) Forest plot displaying the results of the meta‐analysis for TTP.