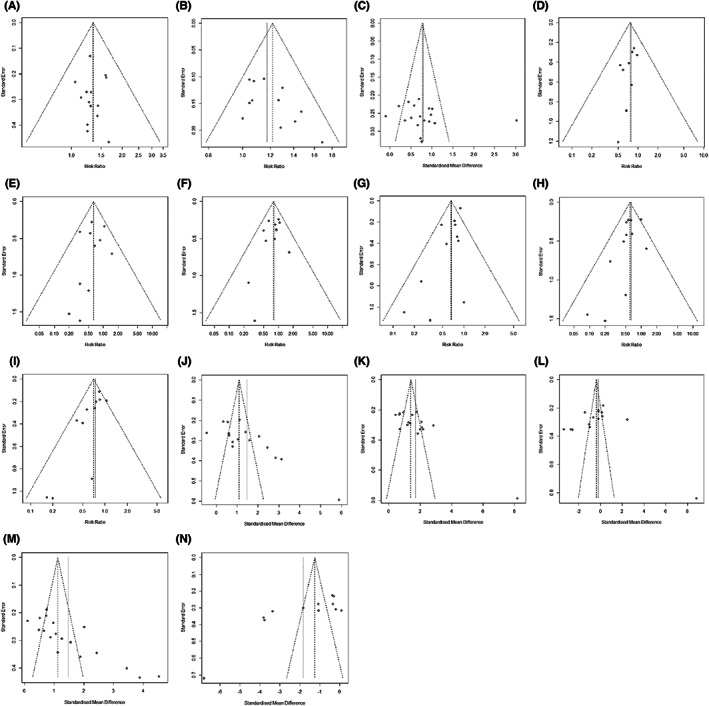
FIGURE 7.

Funnel plots displaying the results of the meta‐analysis for Publication bias analysis. (A) ORR. (B) DCR. (C) KPS (mean ± SD). (D) Thrombocytopenia. (E) Liver/Renal dysfunction. (F) Neurotoxicity. (G) Nausea/Vomiting. (H) Diarrhea. (I) Leukopenia. (J) CD3+ T cells. (K) CD4+ T cells. (L) CD8+ T cells. (M) CD4+/CD8+ T cells. (N) CEA.
