FIGURE 3.

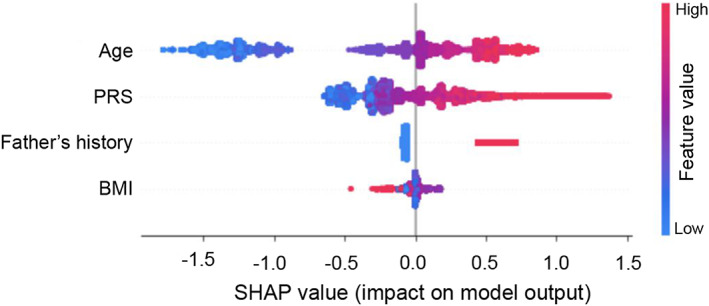
SHapely Additive exPlanations (SHAP) plot of the PRS + Minimal Features model. Display of the top predictor correlations and distribution of feature importance. PRS, polygenic risk score; BMI, body mass index.

SHapely Additive exPlanations (SHAP) plot of the PRS + Minimal Features model. Display of the top predictor correlations and distribution of feature importance. PRS, polygenic risk score; BMI, body mass index.