
FIGURE 3.
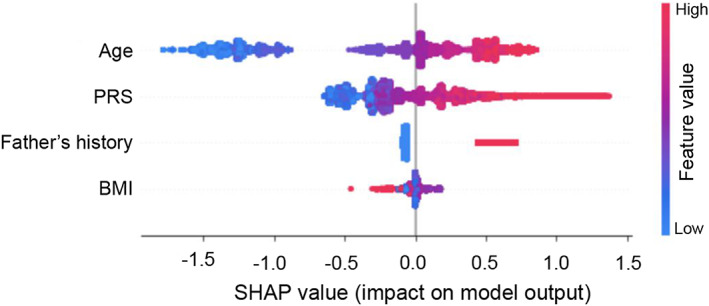
SHapely Additive exPlanations (SHAP) plot of the PRS + Minimal Features model. Display of the top predictor correlations and distribution of feature importance. PRS, polygenic risk score; BMI, body mass index.
Official websites use .gov
A
.gov website belongs to an official
government organization in the United States.
Secure .gov websites use HTTPS
A lock (
) or https:// means you've safely
connected to the .gov website. Share sensitive
information only on official, secure websites.
SHapely Additive exPlanations (SHAP) plot of the PRS + Minimal Features model. Display of the top predictor correlations and distribution of feature importance. PRS, polygenic risk score; BMI, body mass index.