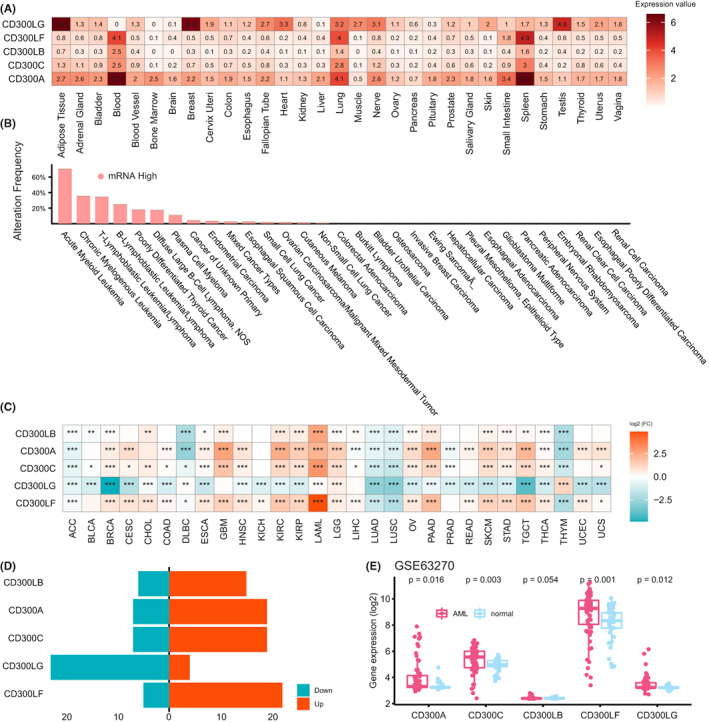
FIGURE 1.

Expression patterns of CD300s in normal tissues, cancer cell lines, and primary tumor samples. (A) Heatmap showing mRNA expression levels of CD300s in normal tissues from the Genotype‐Tissue Expression (GTEx) database. (B) Bar plot showing transcriptional alteration frequencies of CD300s in various tumor cell lines from the Cancer Cell Line Encyclopedia (CCLE) database. (C) Heatmap of differential expression profiles of CD300s between tumor and normal samples, combining data from TCGA and GTEx databases. The color depicts the log2‐transformed fold change (Log2FC) between tumor and normal tissues. *p < 0.05; **p < 0.01; ***p < 0.001. (D) Bar plot showing genes significantly upregulated and downregulated (P < 0.05) across different cancer types. Red, upregulated expression; blue, downregulated expression. (E) Box plots showing expression levels of CD300s in normal controls and AML in the GSE63270 dataset
