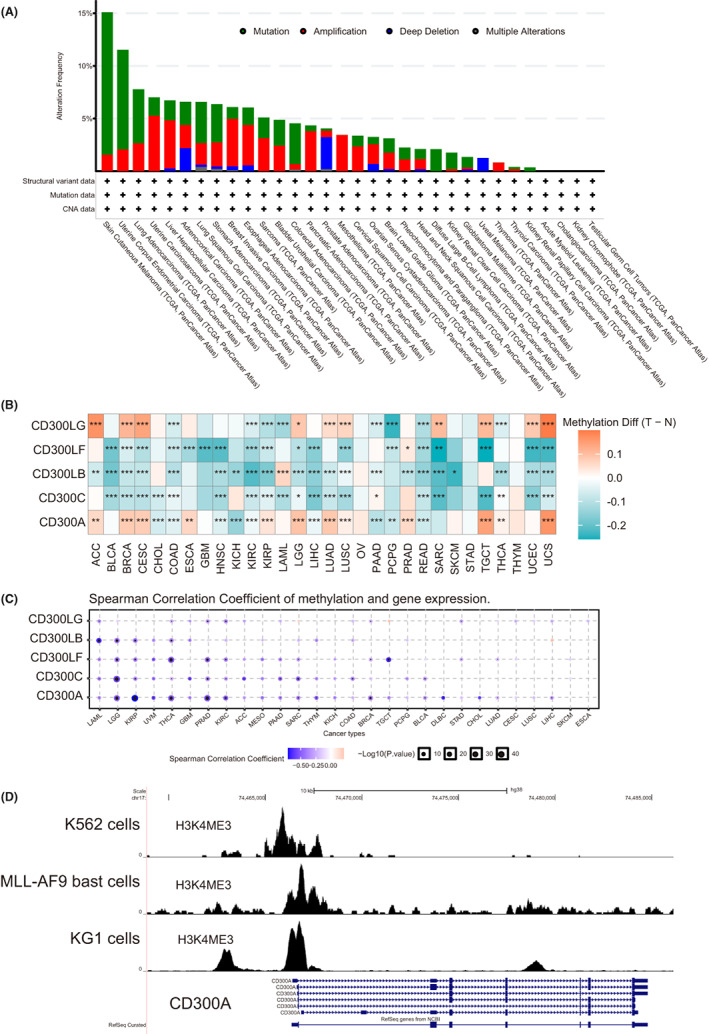
FIGURE 2.

The genetic and epigenetic features of CD300s in pan‐cancers. (A) Genetic alteration ((including mutations, amplifications, and deletions) frequencies of CD300s across different tumors from TCGA. (B) Heatmap of differential methylation profiles of CD300s between tumor and normal samples, using data from the Diseasemeth database. The color depicts methylation differences between tumor (T) and normal (N) tissues. *p < 0.05; **p < 0.01; ***p < 0.001. (C) Correlation between methylation and mRNA expression of CD300s analyzed via the GSCALite platform (http://bioinfo.life.hust.edu.cn/web/GSCALite/). Blue dots indicate negative correlation and red indicate positive correlation. The size of the point represents the statistical significance. (D) ChIP‐seq tracks for H3K4me3 at CD300A gene loci in K562 cells, MLL‐AF9 blast cells, and KG‐1 cells. ChIP‐seq data were obtained from GSE74359, GSE89336, and GSE109619
