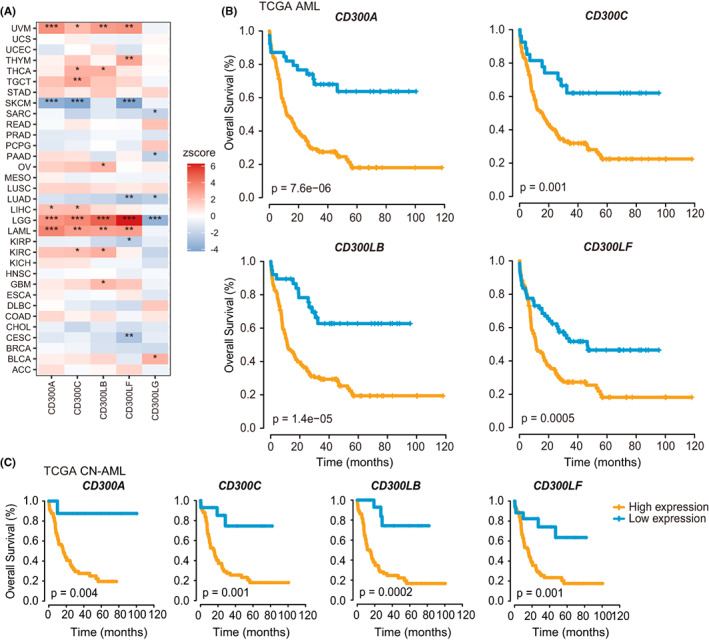
FIGURE 3.

The prognostic significances of CD300s in cancers. (A) Association between CD300s expression and patient prognosis across 33 cancer types as determined by the Cox regression model. (B and C) Kaplan–Meier curves representing OS of AML patients from the whole TCGA cohort (B) and the CN‐AML subsets (C) based on the expression of indicated CD300 members (CD300A‐CD300LF)
