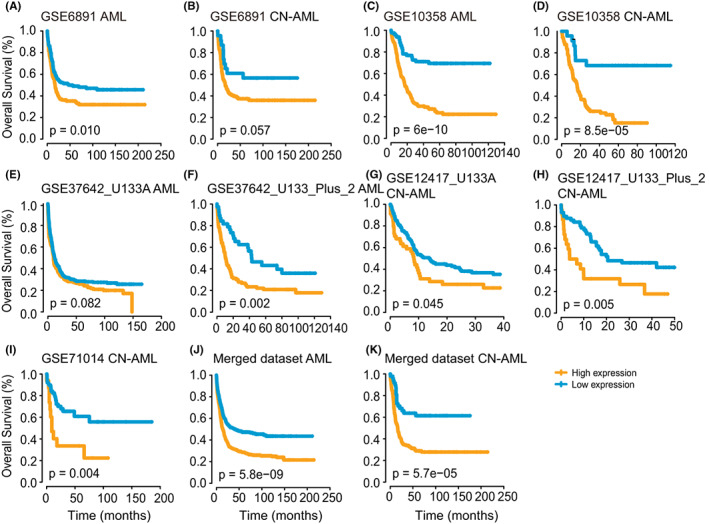
FIGURE 4.

Independent validation of the prognostic value of CD300A. (A‐K) Kaplan–Meier curves representing OS of seven AML cohorts from GEO (GSE6891, n = 293; GSE10358, n = 304; GSE37642 [U133A], n = 422; GSE37642 [U133plus2], n = 140; GSE12417 [U133A], n = 163; GSE12417 [U133plus2], n = 79; GSE71014, n = 104) (A, C, and E‐I), CN‐AML patients from GSE6891 and GSE10358 cohorts (B and D), a merged dataset of 1115 AML patients (J), and 242 CN‐AML patients (K) according to CD300A expression status
