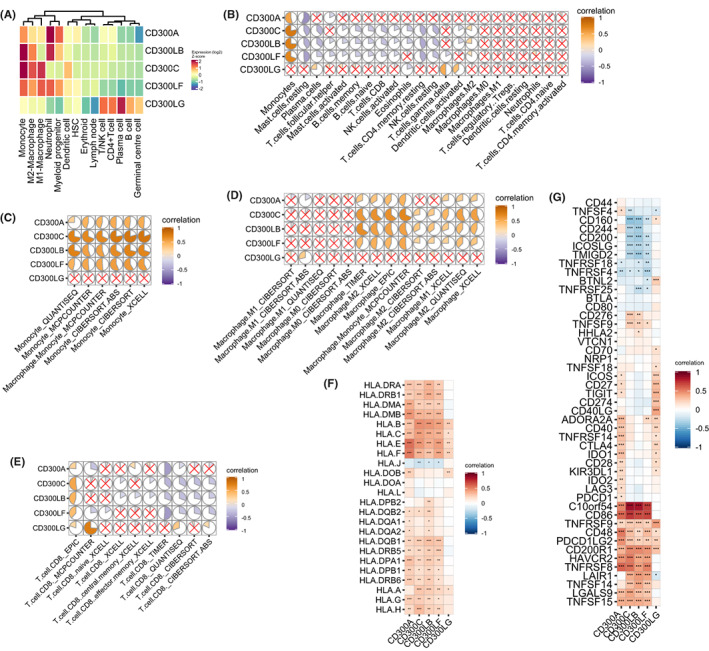
FIGURE 7.

The relation between CD300s expression with immune cell infiltration, HLA genes, and immune checkpoints. (A) Heatmap showing CD300s expression in normal cell populations from the Hemap dataset. (B) Correlation matrix plot showing correlations between CD300s and tumor immune infiltrating cells in AML. The overall immune cell compositions were estimated by CIBERSORT in the TCGA dataset. (C‐E) Correlation matrix plots showing correlations between CD300s with monocytes (C), macrophages (D), and CD8 T cells (E). The overall immune cell compositions were estimated by indicated methods in the TCGA dataset. (F and G) Heatmap showing correlation between the expression of CD300s with HLA genes (F) and immune checkpoint genes (G) in the TCGA dataset
