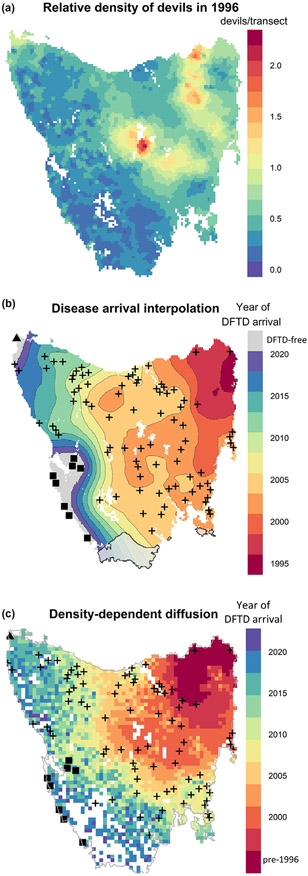
Figure 3.
After discovery in 1996, the spatial spread of DFTD occurred most rapidly through areas of high devil relative density. The spread of DFTD then appeared to slow as the southern and western disease fronts passed through areas of lower devil relative density. (a) Predictive map of devil spotlighting detections, a proxy for density, at the time of DFTD discovery. This map shows that devils were naturally most abundant in the eastern and central part of Tasmania. The model used data from state-wide spotlight surveys prior to the discovery of DFTD (1985–1996). (b) Map of DFTD spread across Tasmania based on a spatial random field and (c) on a stochastic-diffusion simulation model, incorporating a landscape friction layer based on devil relative density, and parameterised using Approximate Bayesian Computation. The estimated year of disease arrival is shown by colours and contours. Black crosses show the first incidences of lab-confirmed cases of DFTD, or of devils with clinical signs of DFTD. The triangle in the far north-west shows the only remaining long-term trapping site that is currently free of disease, while the squares in the south-west show disease-free areas determined by recent camera trapping. White polygons (b) show inland water bodies. The grey polygon in the south (b) denotes an area with very high uncertainty because of sparse data (standard deviation of at least 3 years; Fig. S4). This area of Tasmania is particularly rugged and has no road access, and consequently very little data from which to infer disease spread.

