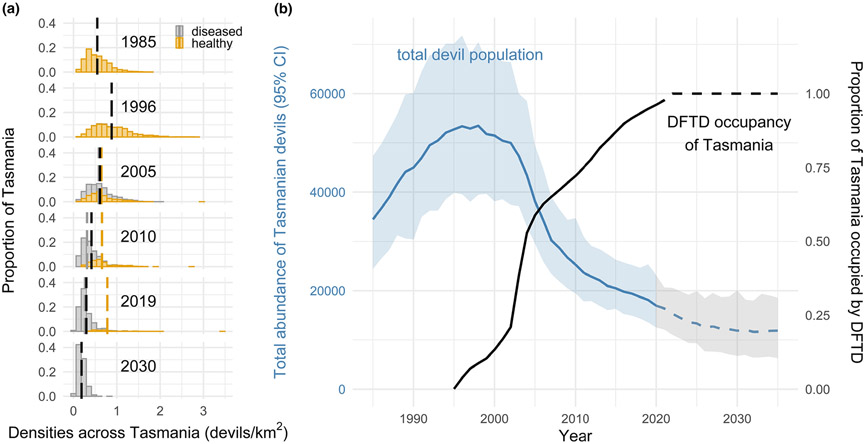
Figure 5.
Changes in the Tasmanian devil population across the entire geographic range of the species. (a) Estimates of devil density across Tasmania at time points from 1985 and 2030. Yellow bars distinguish density in areas that are free of DFTD and grey shows densities where DFTD is present. The vertical dashed lines show the mean density in each disease category, with black denoting the overall mean. (b) Changes in the global abundance (±95% credible interval) of Tasmanian devils. Dashed lines represent forecasts into the future. The black line shows the estimated proportion of Tasmania occupied by DFTD based on the random-field-model of disease spread (Fig. 3b).

