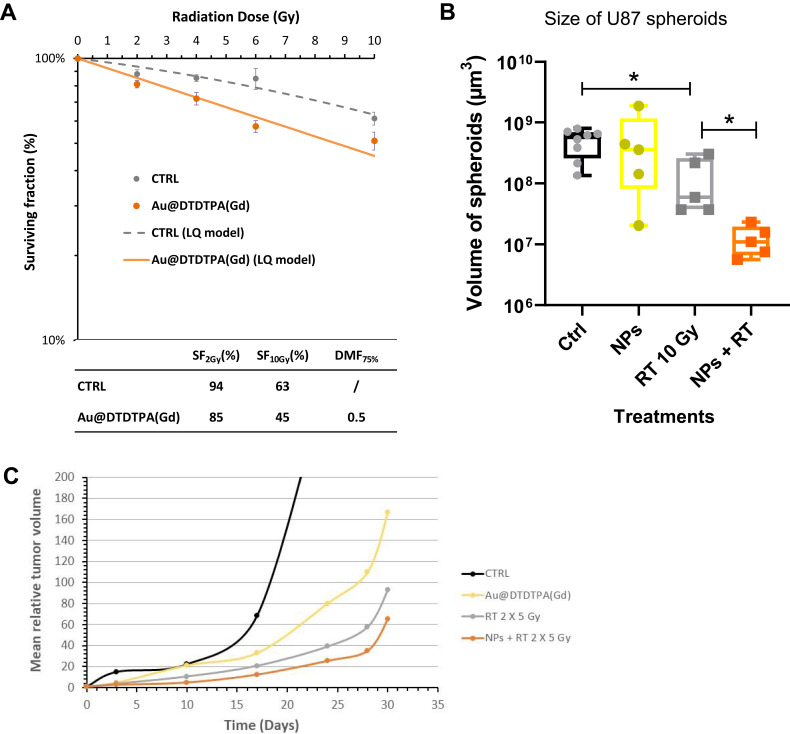
Figure 1.
Radiosensitizing potential of Au@DTDTPA(Gd) nanoparticles. (A) Radiosensitizing effect assessed in vitro by clonogenic assays. U87 cells were incubated with 5 mM Au@DTDTPA(Gd) nanoparticles for 24 hours, washed twice with HBSS and then irradiated at different doses (0, 2, 4, 6, 10 Gy) in fresh culture medium. A total of 104 cells were plated in soft-agar in 6-well plates and incubated for 12 days at 37°C 5% CO2. Surviving colonies containing at least 50 cells were counted using GelCount™ (Oxford Optronix, Abingdon, UK). Results of clonogenic assays were plotted as survival curves. The experimental data were fitted to a linear quadratic (LQ) model, according to the equation  . SF2Gy and SF10Gy are respectively the surviving fractions at 2 and 10 Gy, respectively; DMF is the dose modifying factor. (B) Antitumor activity of treatments assessed in vitro using 3D cell culture models. After 7 days growth in spinner, U87 spheroids were seeded in low-attachment 6-well plates. They were exposed to 5 mM Au@DTDTPA(Gd) nanoparticles (NPs) for 24 hours at T7 and/or irradiated with 10 Gy-monodose (RT 10 Gy) on T8. Subsequently, the U87 spheroids were seeded individually into a precoated 96-well plates. Each spheroid was imaged and their volume determined on the day of seeding and 8 days later. Results are presented as boxplot of data (n ≥ 5). * = significant difference at p < 0.05 according to the Mann–Whitney U-test (C) In vivo evaluation of the effects of treatments on tumor progression. For in vivo experiments, we used an intracerebral xenograft model of U87-GFP spheroids under chronic cranial windows. Treatments started 5 days after spheroid implantation, thus defining the D0 of follow-up. The nanoparticles were injected intravenously at a dose of 75 mg/kg from a 10 g/L solution. Radiotherapy-treated mice received a 2×5 Gy regimen. For combined treatments, Au@DTDTPA(Gd) nanoparticles were administered 5 min before the first fraction of radiation. Intravital microscopy using a Nikon AZ100 fluorescence microscope (Nikon, France) allowed us to follow the progression of intracranial U87-GFP tumors. Based on the recorded fluorescence images, tumor volumes were determined and relative tumor volumes (RTV = VDx/VD0) were calculated. The graph represents the mean tumor growth curve plotted for each treatment group.

