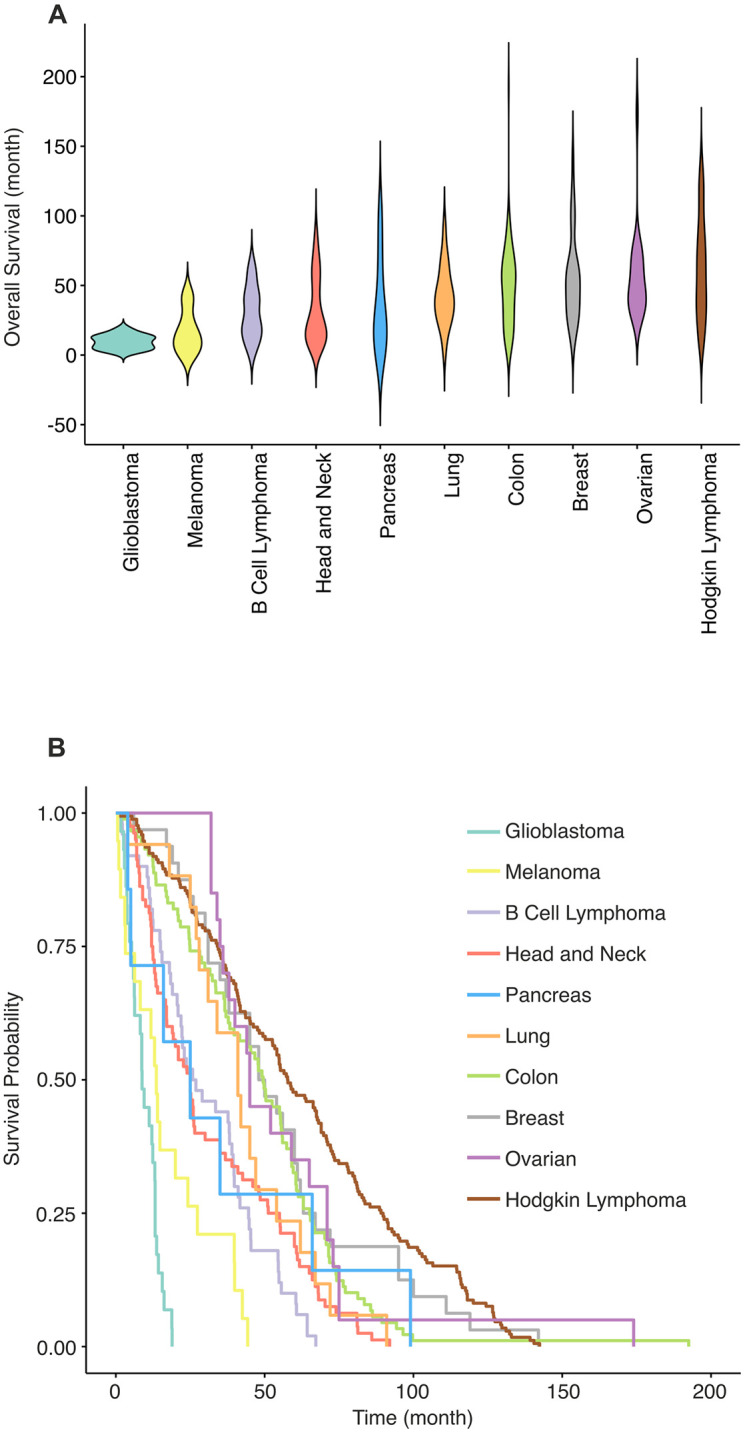
Fig 1. Overall survival and survival probability by cancer type.

(A) A violin plot showing the distribution of overall survival (OS) rate for all 515 patients grouped according to their cancer type. OS rate of patients is shown in months on the y-axis. Cancer types are shown on the x-axis and are ordered by average overall survival rate for each cancer type, from lowest to the highest. (B) Kaplan-Meier estimation curves show survival probability of cancer types. Each curve represents a different cancer type (Kaplan-Meier log-rank test, P < 0.0001). Both panel A and panel B show that glioblastoma and melanoma have the lowest survival rates whereas patients with colon, breast and ovarian cancers, and Hodgkin lymphoma, tend to live longer.
