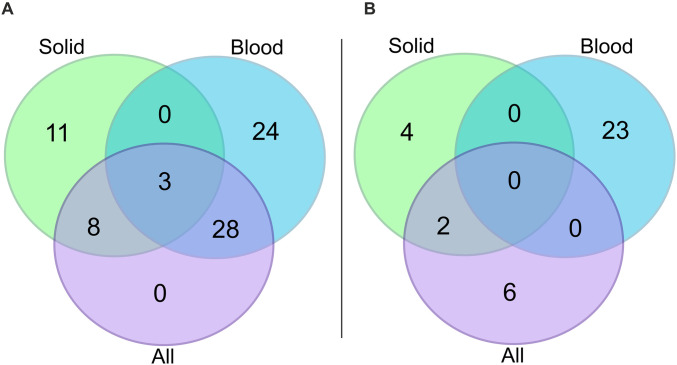
Fig 5. Overlap of differentially expressed genes according to survival across cancer classifications.
Venn diagrams to visualize the numbers of significantly differentially expressed genes that overlap across the three differential gene expression analyses that were conducted: considering all patients (n = 515; mauve), considering only solid cancer patients (n = 293; green), and considering only blood cancer patients (n = 222; blue). Panel A shows the overlap of upregulated genes and panel B shows the overlap of downregulated genes across the three differential gene expression analyses.

