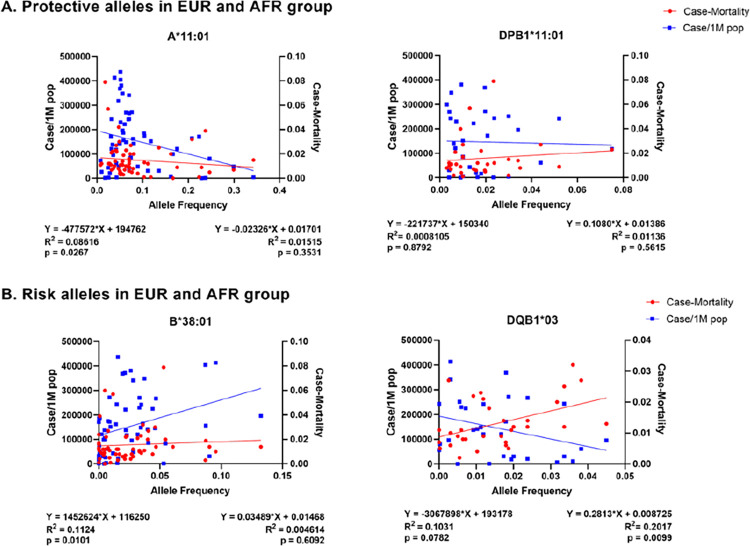
Fig 7. Worldwide HLA allele frequency and COVID-19 case/1M population and case- mortaliy.
Association of protective and risk alleles in EUR and AFR cohort with worldwide case per one million population and case-mortality. Each dot represents a country plotted by average allele frequency (x-axis) with case-mortality (red, right y-axis) and case/1M population (blue, left y-axis). The equation and values below the image (left, case/1M population; right, case-mortality) show the quadratic equation for predicting trend of linear regression, the R-squared (coefficient of determination) and the two tailed p-value for the correlation analysis. (A) Association of proteictive alleles in EUR and AFR corhort. (B) Association of risk alleles in EUR and AFR corhort.

