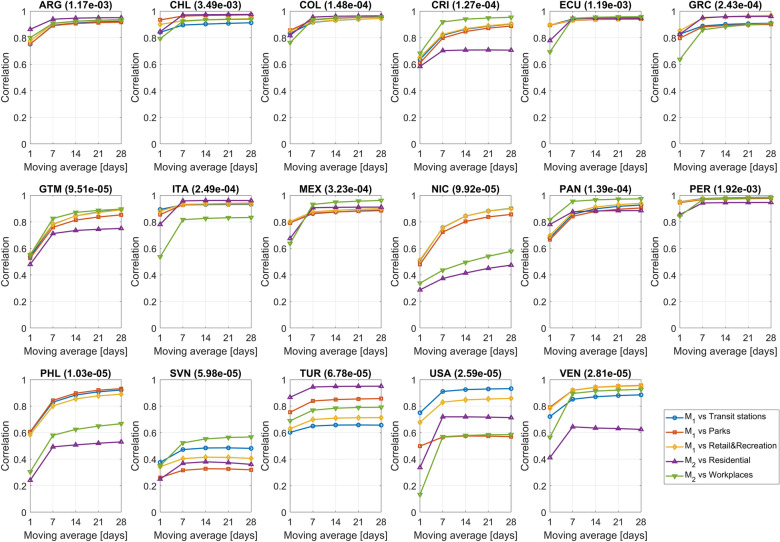
Figure 3.
Linear correlation between the M1 mobility metric and Google’s “Transit stations” index, between M1 and Google’s “Parks” index, between M1 and Google’s “Retail and Recreation” index, between the M2 mobility metric and Google’s “Residential” index and between the M2 and Google’s “Workplaces” index. 1-day moving average means no smoothing. All correlations between M2 and Google’s “Workplaces” index are negative but they are reported without sign to assure readability of the plots. In brackets, the average data set penetration in each country.

