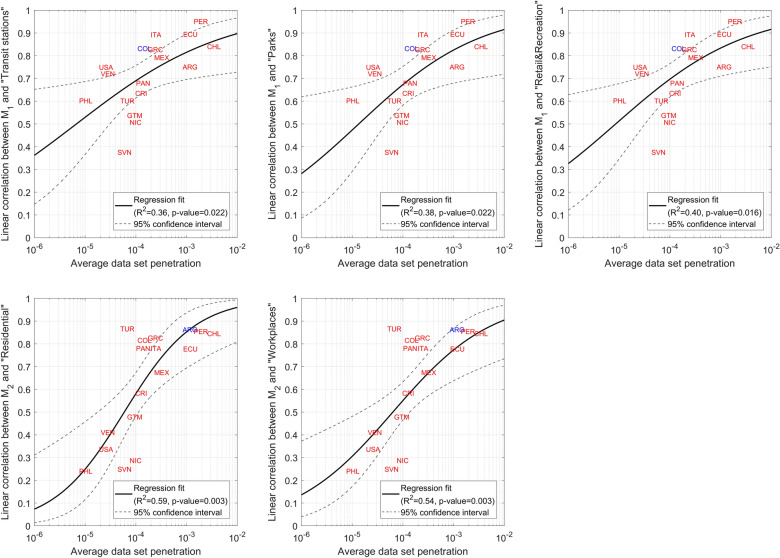
Figure 5.
Linear correlation between M1 and M2 and Google’s mobility indices vs average data set penetration for the 17 countries under the non-smoothing case. Solid lines are the fits by a beta regression model with logit link function, while dashed lines are 95% confidence intervals on fitted values. R2 are pseudo coefficients of determination, while the p-values refer to an F-test on the regression model, which tests whether the model fits significantly better than a model with only the constant term. Each label is a country. Overlapping labels are in different colours. All correlations between M2 and Google’s “Workplaces” index are negative but they are modelled without sign to keep consistency with Fig. 3 and to allow beta regression.

