
Figure 3.
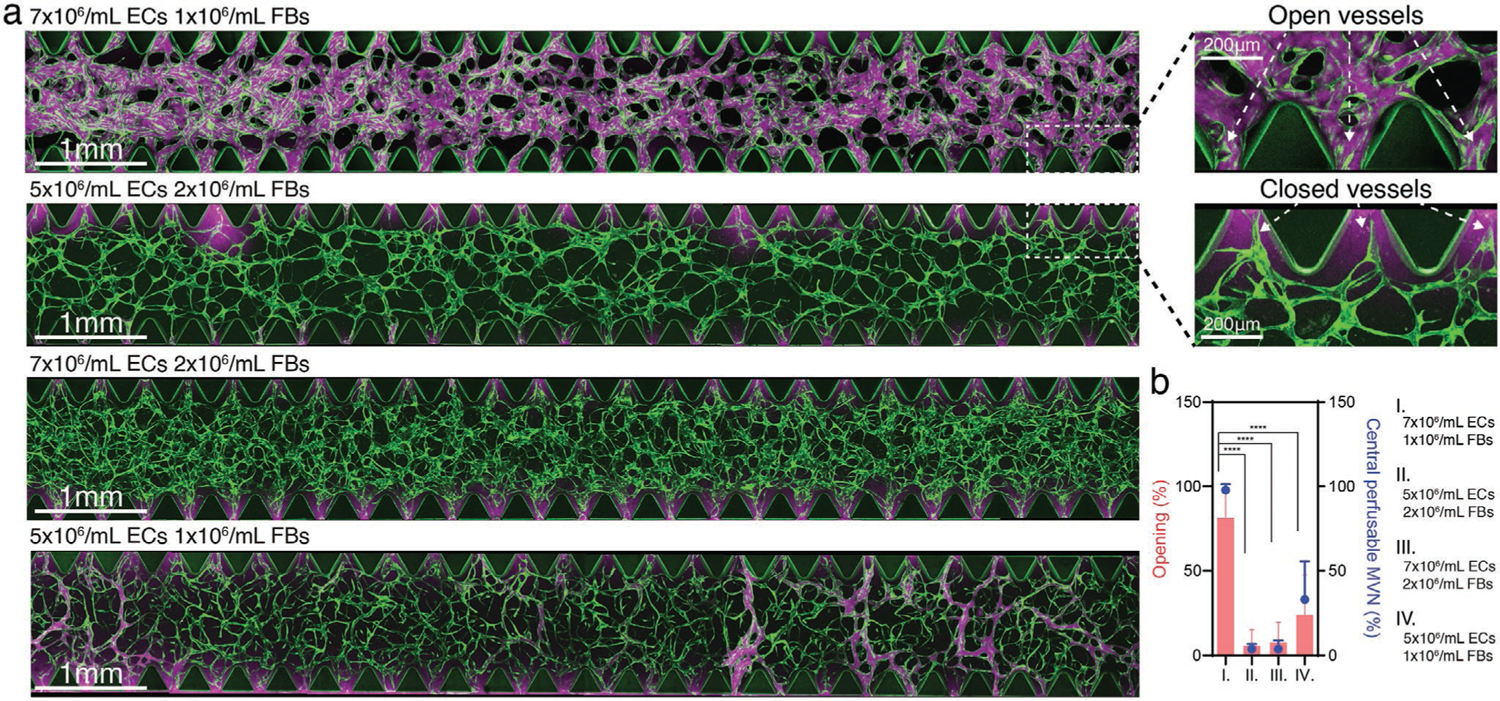
Seeding density determines MVN perfusability. a) Representative confocal images of MVNs formed with ImHUVECs expressing BFP and lung FBs at various concentrations (left). Zoomed in images of microvessels in the regions between microposts showing vessel openings and closed vessels (right). Lower EC and higher FB densities led to lower opening percentation and less or non-perfusable MVN formation. Green, ImHUVECs. Magenta, dextran (70 kDa). b) Statistical analysis of microvessel opening percentage (bars) and central perfusable MVN percentage (dots) in each ROI of MVNs made at various EC and FB concentrations. Bars represent mean ± SD. Two-tailed t tests were performed for the statistical comparisons (n = 3 devices, 5 ROIs each).